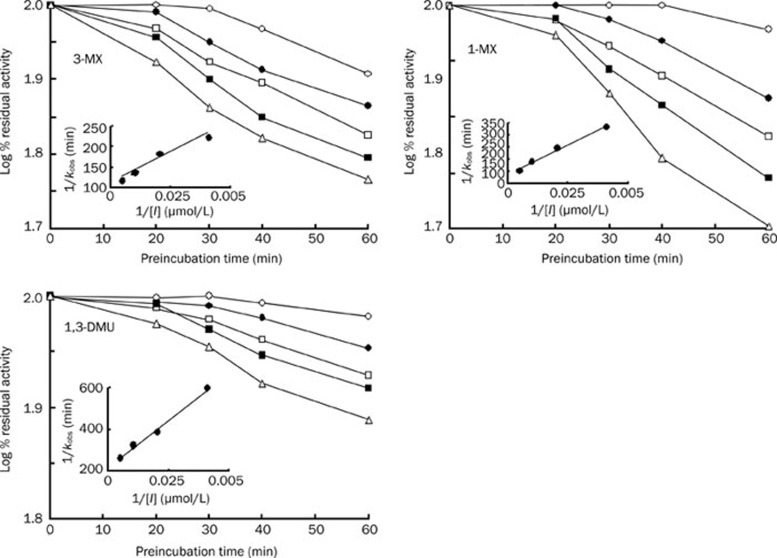
Figure 3.
Kinetics of inactivation of microsomal TP metabolism by ATFX (n=5). Human liver microsomes were pre-incubated for the indicated times in an NADPH-generating system, and ATFX, followed by CYP1A2 activity, was measured. Symbols: open circle, 0 μg/mL ATFX; filled circle, 100 μg/mL ATFX; open square, 200 μg/mL ATFX; filled square, 400 μg/mL ATFX, and open triangle, 800 μg/mL ATFX. The insets correspond to the double reciprocal of the inactivation rates as a function of ATFX concentration.

