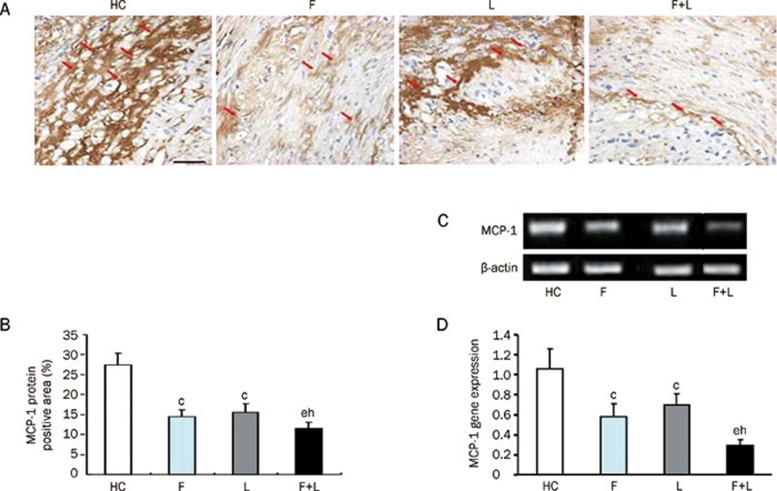
Figure 4.
MCP-1 protein and gene expression in the four groups. (A) MCP-1 protein expression in the four groups by immunohistochemical staining (magnification×40, scale bars equal 50 μm). (B) Quantification of the MCP-1 protein level by immunohistochemical staining in the four groups. (C) MCP-1 mRNA expression levels by RT-PCR in the four groups. (D) Quantification of MCP-1 mRNA levels by RT-PCR in the four groups. cP<0.01 vs HC-diet group; eP<0.05 vs fluvastatin group; hP<0.05 vs losartan group. Mean±SD. n=9.

