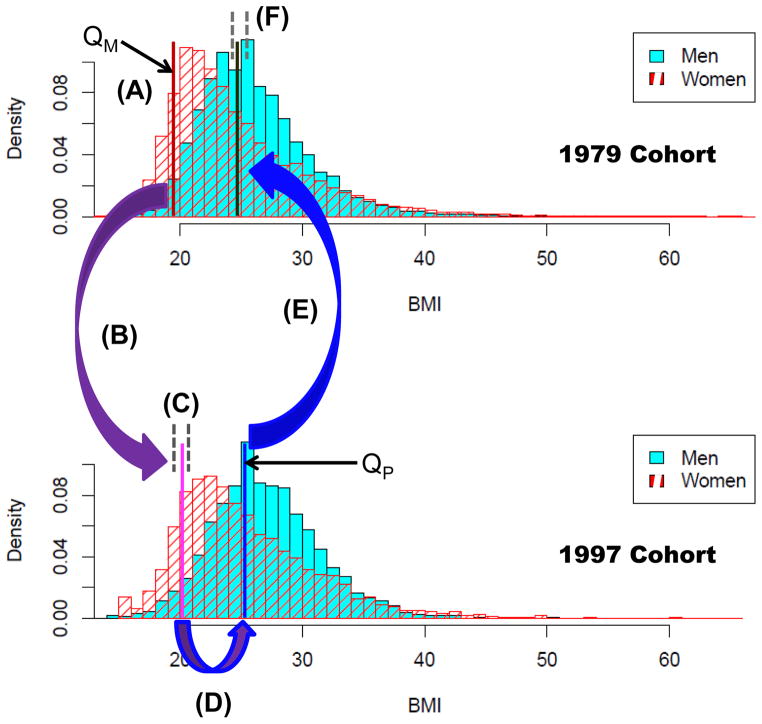
Figure 2.
An overview of the m2 mapping. Given a maternal BMI, we calculate the percentile that it corresponds to among all BMIs recorded in the 1979 cohort of women; call it QM (A). We then gather all mothers in the 1997 cohort that have a recorded BMI within a one-percentile window of QM (B) and choose one at random (C). The BMI of the selected woman’s mate is then converted into a percentile QP (D), as calculated from the 1997 distribution of fathers. We then conclude the mapping by gathering all men in the 1979 cohort with BMIs within a one-percentile window of QP (E) and choose one at random (F), to be the mate for our original 1979 cohort mother.

