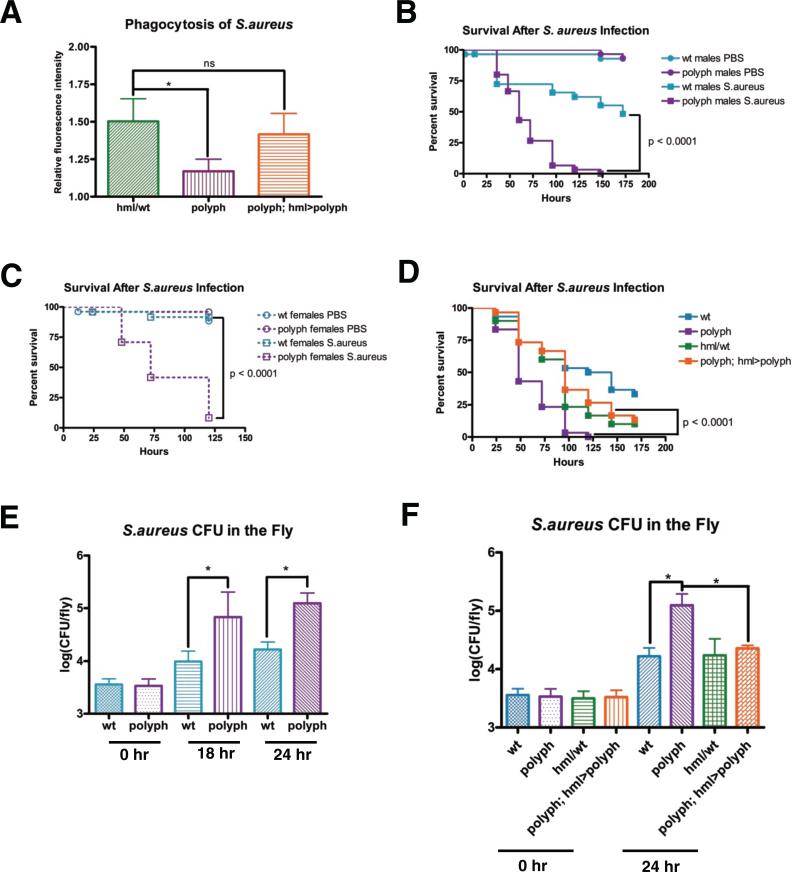
Figure 2. polyph flies have decreased resistance against an S.aureus infection.
(A) Quantification of the phagocytosis of fluorescein-labeled S.aureus bioparticles in hml/wt, polyph, and polyph; hml>polyph flies. Approximately 6 flies per genotypewere used in each experiment. Representative survival curves of male (B) and female (C) wt and polyph flies after injection of S.aureus (OD 0.5). n = 24-30 flies. Experiments were performed in triplicate. (D) Representative survival curve of wt, polyph, hml/wt, and polyph; hml>polyph flies after injection of S.aureus (OD 0.5). The wt flies have polyph's genetic background, while hml/wt flies have the same genetic background as the rescue flies in which polyph expression is driven by hmlΔGAL4. n = 28-30 flies. Experiments were performed in triplicate. (E) Comparison of the S.aureus (OD 0.5) recovered in wt and polyph flies 0, 18, and 24 hours postinfection. Bacterial load was measured in 8 individual flies per genotype at each time point in each experiment. Experiment was performed in quadruplicate. (F) Comparison of the S.aureus (OD 0.5) recovered in wt, polyph, hml/wt, and polyph; hml>polyph flies 0 and 24 hours postinfection. Three replicate experiments were performed. Error bars, ±SE. *p<0.05, ns = not significantly different

