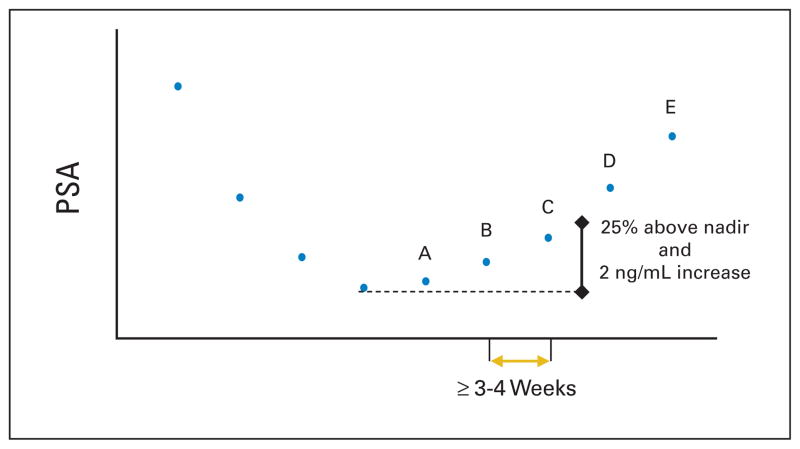
Fig. 4.
Prostate-specific antigen (PSA) progression. An increase of 25% and absolute increase of 2 ng/mL or more above the nadir. Values A, B, and C show rising PSA values that do not meet the criteria. Value D is the first PSA value that is greater than 25% and more than 2 ng/mL above the nadir, confirmed with a further rise in PSA shown by value E. For reporting purposes, PSA progression would be recorded on the date value D was obtained.

