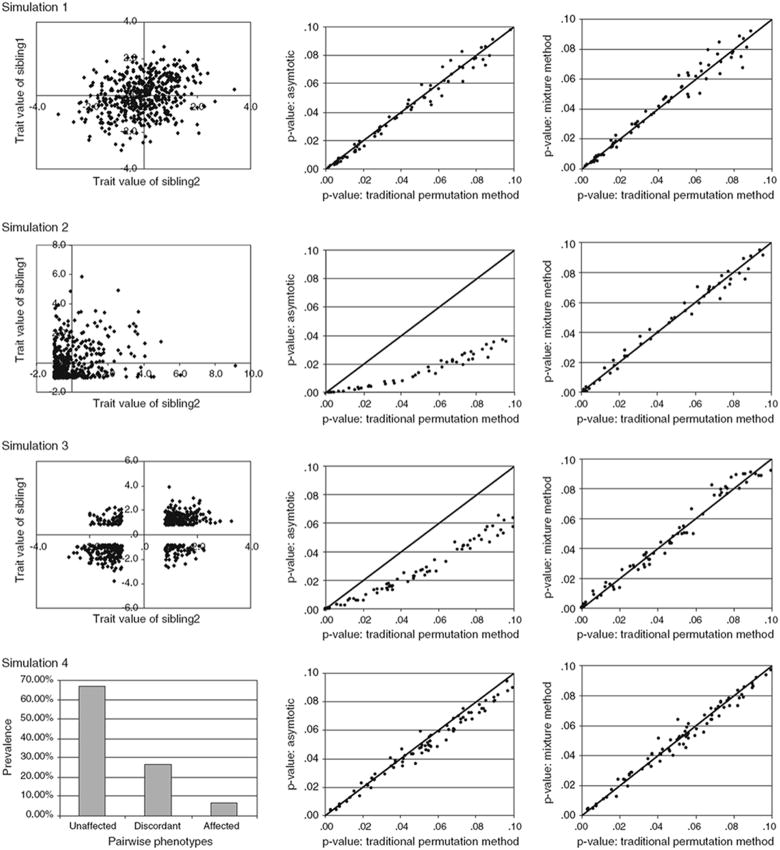
Fig. 2.
Graphical summary of the analyses of the univariate data sets. Rows: 1st results from a normally distributed continuous variable, 2nd a highly skewed continuous variable resulting from threshold based ascertainment, 3rd a normally distributed continuous variable with EDAC sampling, 4th a binary variable with a 20% prevalence. Columns (left to right): The bivariate distribution of the phenotypic values (the trait value of sibling 1 is shown on the y axis while sibling 2 is shown on the x axis, a pair-wise prevalence graph is given for the binary data); for P-values <0.1 asymptotic P-values graphed against empirical P-values from 5,000 permutations/locus (with x = y reference line); for P-values <0.1 mixture distribution P-values graphed against empirical P-values from 5,000 permutations/locus (with x = y reference line)

