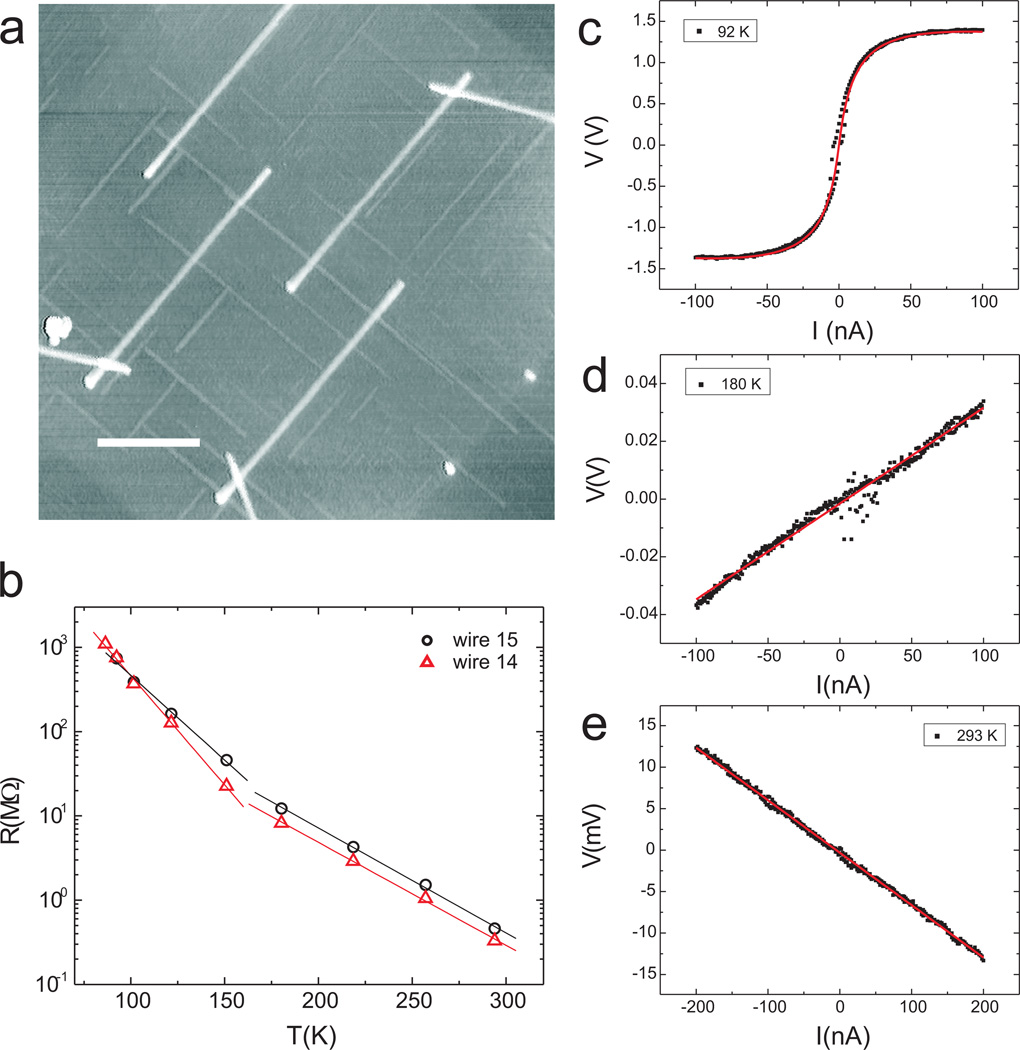
Figure 3.
Characterization of YSi2 wire network devices. (a) AFM image illustrating one example of a YSi2 network device (wire 15) (scale bar: 370 nm). (b) Temperature dependence of the corrected zero bias resistance (see text) of two YSi2 network devices, wire 14 (Supporting Information) and wire 15. The solid lines represent linear fits. (c), (d), (e) I – V characteristics of a network device (wire 15) at the indicated temperatures. The solid lines represent fits to the data using eq 2.

