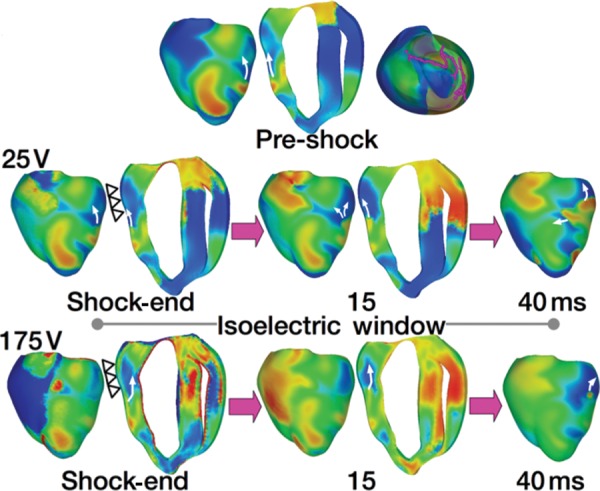
Figure 3.

Tunnel propagation of activations following defibrillation shocks in the rabbit heart. Arrows indicate direction of propagation. Presented is the submerging of a pre-shock fibrillatory wavefront by a strong biphasic shock delivered from an ICD. The figure shows the model, the fibrillatory pre-shock state (with scroll-wave filaments, the organizing centres of reentry, shown in pink), and post-shock Vm maps for two shock strengths at different post-shock timings. In contrast to the 25 V shock, the near-DFT 175 V shock converted the LV excitable area into an intramural excitable tunnel (see triangular arrows in shock-end panel) with no apparent propagation on the epicardium; the wavefront propagated in it until epicardial breakthrough following the isoelectric window. Images based on figures published in Constantino et al.5
