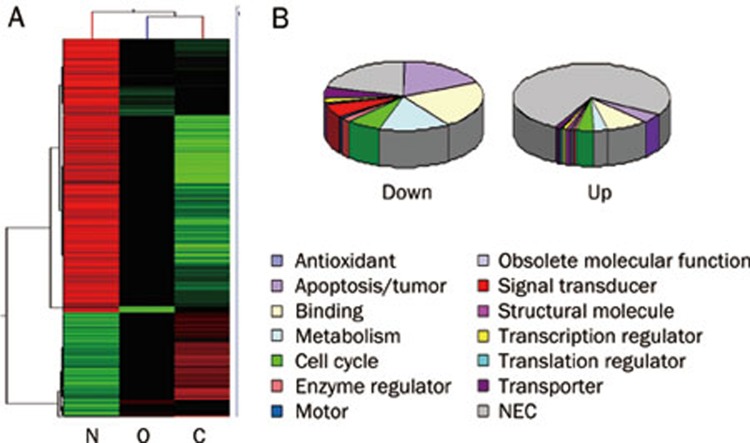
Figure 1.
Gene expression profiles. Comparative analysis was performed to show the differentially expressed genes in high cholesterol fed and OVX rats. Cluster analysis of differentially expressed genes in high cholesterol fed rats and OVX rats. (B) The functional distribution of the differentially expressed genes in high cholesterol fed rats and OVX rats. N: normal rats; O: OVX rats with osteoporosis; C: high cholesterol fed rats.

