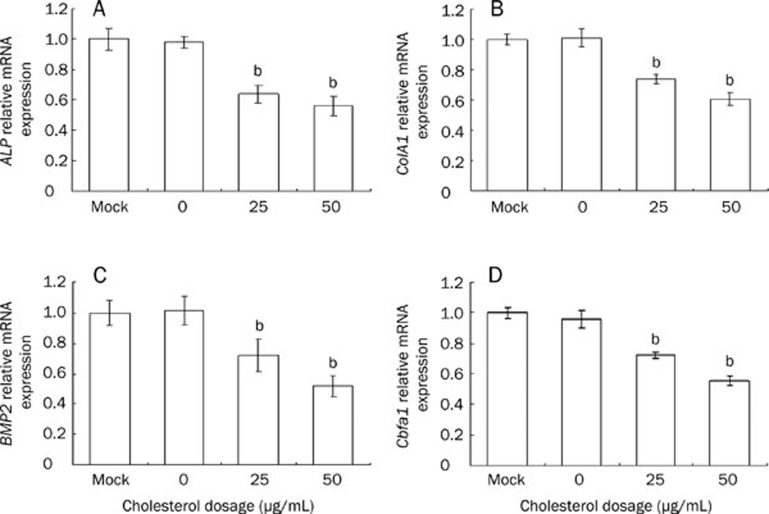
Figure 3.
The expression of ALP, ColA1, BMP2, and Cbfa1 genes in MC3T3-E1 cells after the treatment of cholesterol. (A) ALP, (B) Collagen I, (C) BMP2 and (D) Cbfa1 were analyzed by real-time PCR. Data are shown as the mean±SD of three wells for each group within one experiment, and it was repeated for three times. bP<0.05 vs Mock.

