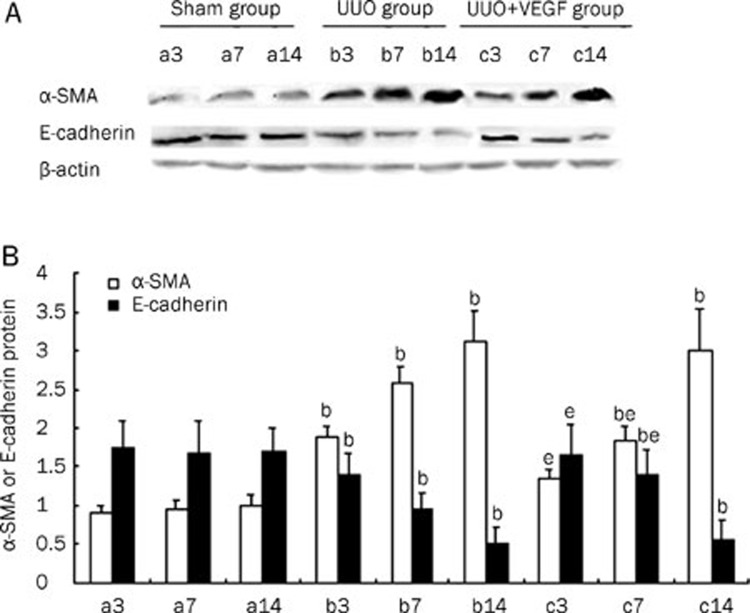
Figure 3.
The expressions of α-SMA and E-cadherin protein in sham mice (a), UUO mice (b) and VEGF-treated mice (c) at d 3, 7, and 14, respectively. (A) Representative Western blot of α-SMA and E-cadherin in sham and UUO mice treated with or without VEGF. (B) Compared with UUO group, VEGF treatment significantly inhibited α-SMA expression and increased E-cadherin expression at d 3 and 7. Results were shown as ratio of optical density for α-SMA or E-cadherin to that of β-actin and presented as mean±SD of 3 independent experiments. bP<0.05 vs respective sham mice; eP<0.05 vs respective UUO mice.

