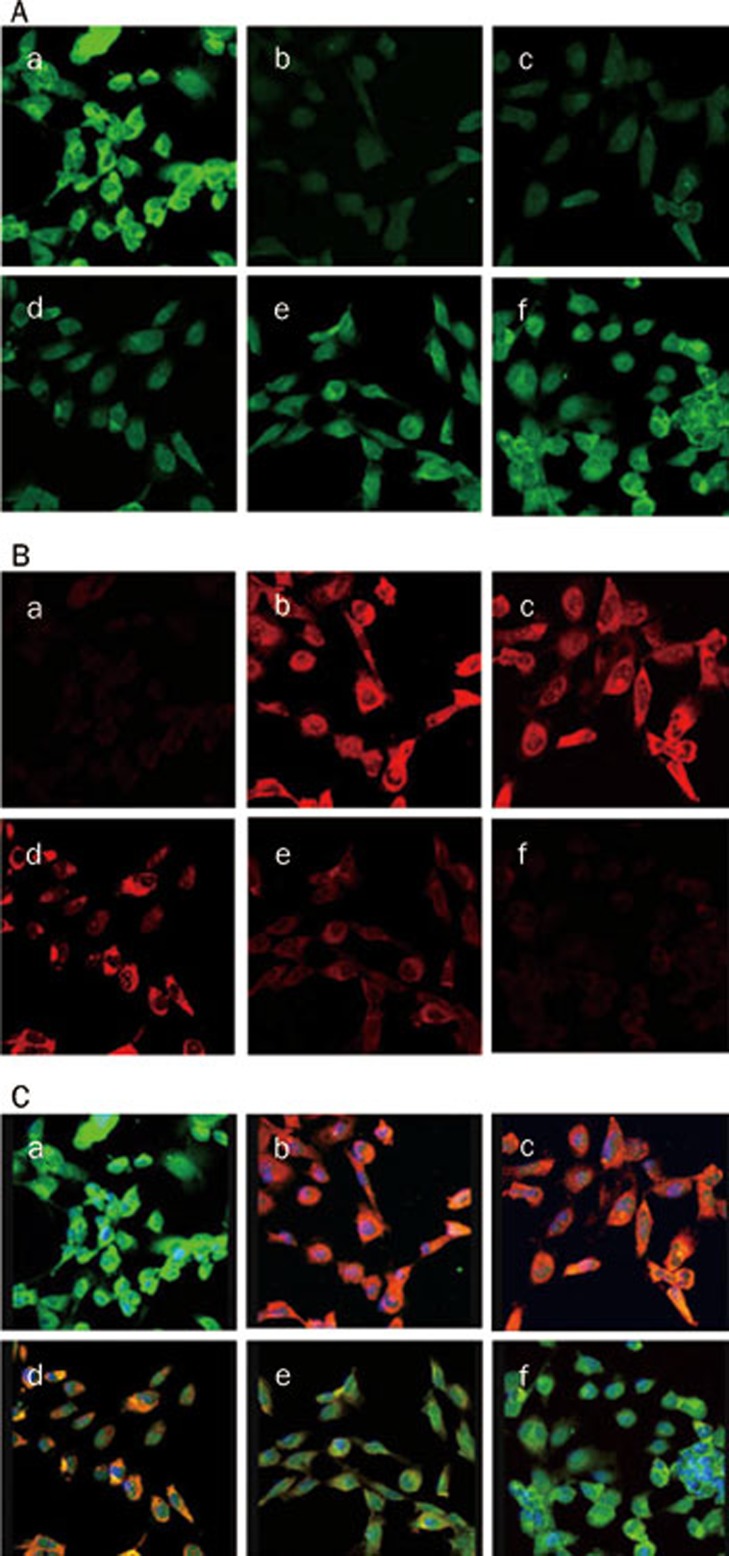
Figure 7.
Expressions of E-cadherin and α-SMA in HK-2 cells treated with 5 μg/L TGF-β1 in the presence or absence of VEGF at 0.1–100 μg/L, evaluated by confocal microscopy. The expression of E-cadherin (A) and α-SMA (B) were observed by confocal microscopic image. The colocalization (C) of α-SMA and E-cadherin was stained yellow. a, no treatment; b, 5 μg/L TGF-β1; c, 5 μg/L TGF-β1 and 0.1 μg/L VEGF; d, 5 μg/L TGF-β1 and 1 μg/L VEGF; e, 5 μg/L TGF-β1 and 10 μg/L VEGF; f, 5 μg/L TGF-β1 and 100 μg/L VEGF. ×100.

