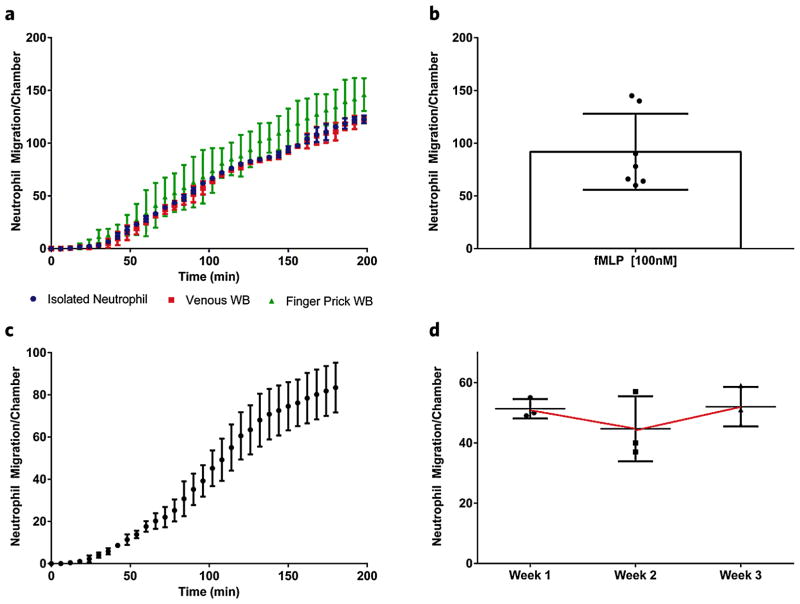
Figure 3.
Validation of whole blood platform. (a) Neutrophil migration counts are compared between venous and finger prick blood sources and isolated neutrophils. A similar delay time, accumulation rate and final cell count are observed in all three conditions migrating to fMLP [100 nM]. Graphs correspond to average cell counts in all FCCs (n = 16). (b) Neutrophil migration counts per chamber are compared for 7 healthy volunteers. (c) Average neutrophil migration counts to fMLP [100 nM] in 6 separate whole blood devices. (d) Baseline for neutrophil migration in healthy donor to fMLP [100 nM] over a 3 week time course.

