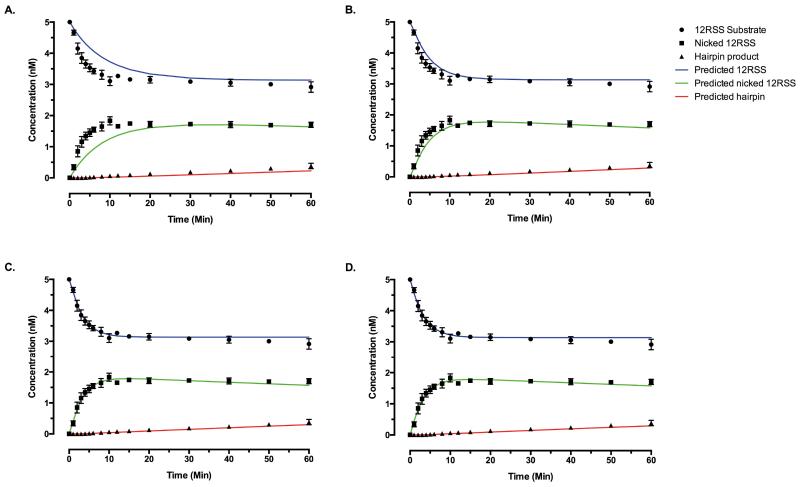
Figure 4. The outcome of curve fitting for Models 1, 5, 7, and 8.
Predicted concentrations of 12RSS substrate (blue), nicked 12RSS (green), and hairpin 12RSS (red) based on the best fit of (A) scheme 1, (B) scheme 5, (C) scheme 7, and (D) scheme 8 are shown in solid lines. Experimentally measured concentrations of 12RSS, nicked 12RSS, and hairpin 12RSS are shown in points with error bars as explained in Figure 1. See text for more information on conditions and assumptions of curve fitting. Schemes 7 and 8 provide similarly good fits for other RAG couple-cleavage time courses that start with different substrate concentrations (data not shown).

