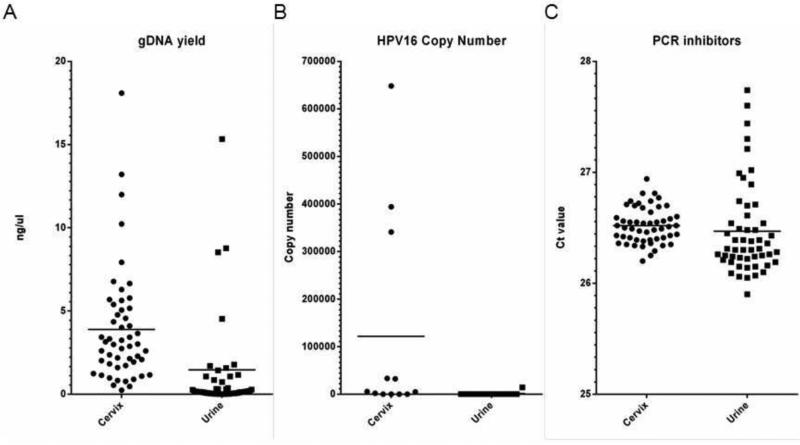
Figure 4.
Scatter plots showing results for gDNA yields (A), human papillomavirus (HPV) 16 copy number per μL (B), and Ct values for the external template (inhibitor assay) (B), as measured by quantitative polymerase chain reaction (PCR) assays. Median values are indicated by vertical bars in each plot.

