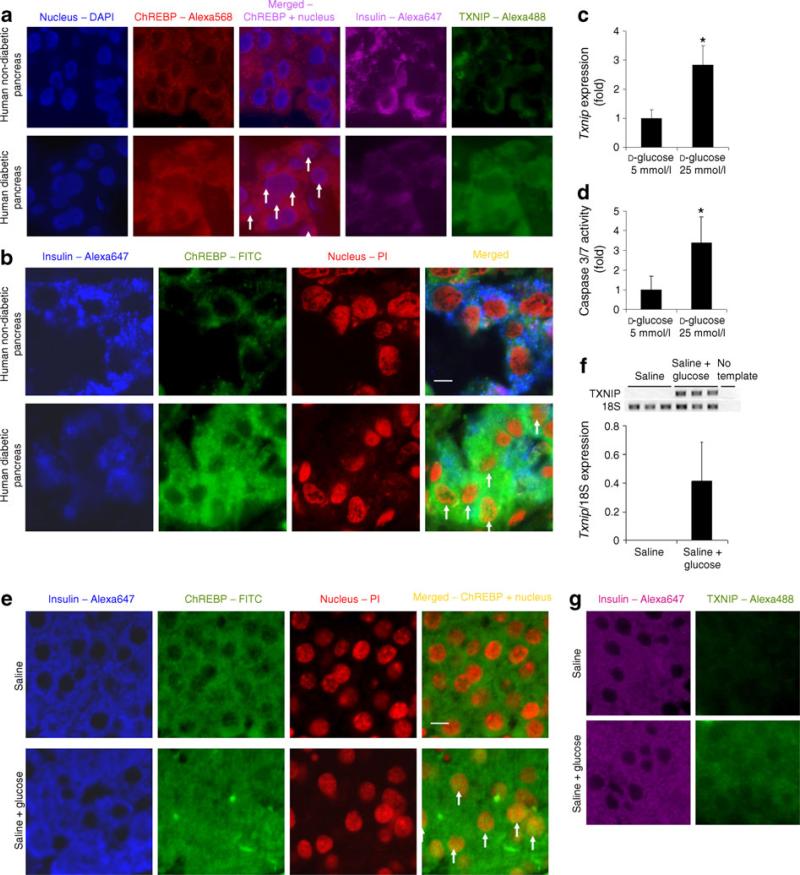
Fig. 4.
Activation of Chrebp in pancreatic beta cells is associated with Txnip upregulation in vivo. a Diabetic human beta cells produce high levels of Chrebp and Txnip protein. We stained for nucleus (blue), Chrebp (red), insulin (purple) and Txnip (green) in non-diabetic and diabetic pancreas paraffin sections and imaged by fluorescence microscopy. b More nuclear Chrebp is present in diabetic beta cells. We labelled insulin (blue), Chrebp (green), nucleus (red) and imaged by confocal microscopy to confirm nuclear localisation of Chrebp (yellow colour in merged picture) in non-diabetic and diabetic pancreas. White arrows indicate the presence of nuclear Chrebp in the beta cells from the pancreatic sections of diabetic patients. c Txnip expression is upregulated in isolated islets. We performed qRT-PCR to detect Txnip expression in isolated islets treated with 5 or 25 mmol/l d-glucose for 48 h and normalised to Eef1g expression. d High glucose induces caspase-3/7 activity in isolated islets. We incubated isolated islets in medium containing 5 or 25 mmol/l d-glucose for 72 h and measured caspase-3/7 activity. e Glucose-induced hyperglycaemia activates Chrebp in vivo. Pancreas paraffin sections from mice injected with 77 mmol/l NaCl only or glucose in 77 mmol/l NaCl solution for 24 h were stained for nucleus (red), Chrebp (green) or insulin (blue) and imaged by confocal microscopy. White arrows indicate the presence of nuclear Chrebp in the beta cells from the pancreatic sections of mice with glucose-induced hyper-glycaemia. f Upregulation of Txnip transcripts by glucose-induced hyperglycaemia. We isolated pancreatic islets from mice injected with glucose or 77 mmol/l NaCl by the LCM technique and extracted RNA. We performed qRT-PCR to quantify Txnip expression, which is normalised by expression of Rn18s. g Txnip protein production is also induced in glucose-injected mice. We stained pancreas paraffin sections from 77 mmol/l NaCl- or glucose-injected mice for insulin (purple) or Txnip (green). *p<0.05 compared with cells treated with 5 mmol d-glucose. Scale bar, 5 μm

