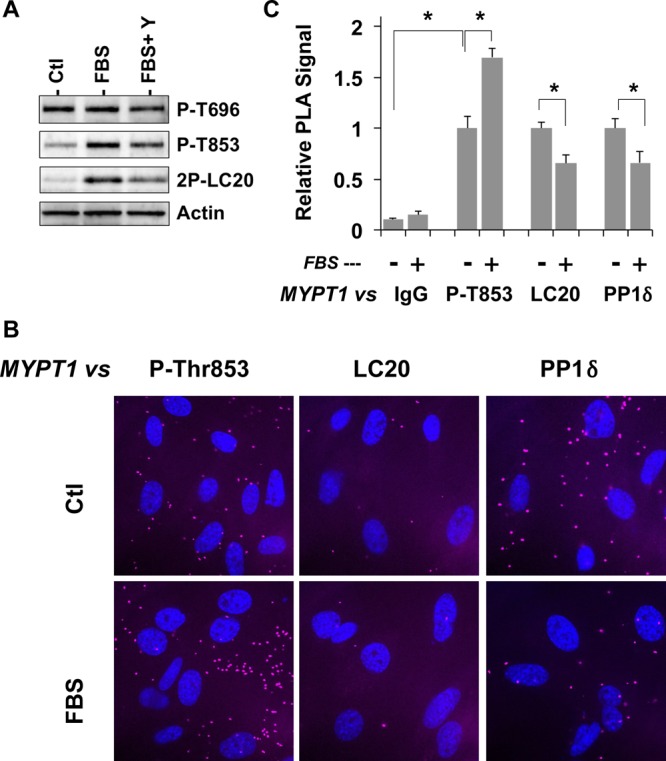
Figure 5.

Phosphorylation and regulation of MLCP in leiomyosarcoma. (A) Cellular phosphorylation of MYPT1. Quiescent leiomyosarcoma cells were stimulated for 1 h with 10% FBS in the absence and presence of 10 μM Y27632, fixed with 10% TCA, and subjected to immunoblotting. 2P-MLC20 denotes MLC20 diphosphorylated at Thr18 and Ser19. (B and C) PLA analysis. Quiescent and FBS-stimulated cells on coverslips were fixed with 10% TCA (for P-Thr853) or 4% paraformaldehyde (MLC20 and PP1δ) and subjected to the PLA using anti-total MYPT1 paired with preimmune IgG (control), anti-P-MYPT1(T853), anti-MLC20, and anti-PP1δ. Magenta and blue portions are the PLA signal and the nucleus, respectively (B). Numbers of PLA spots and nuclei were obtained in each image field. The mean value ± SEM of the ratio of the number of PLA spots to the number of nuclei was obtained from 12–43 image fields in two independent assays (C). Asterisks denote p < 0.05 vs the quiescent condition.
