Figure 5.

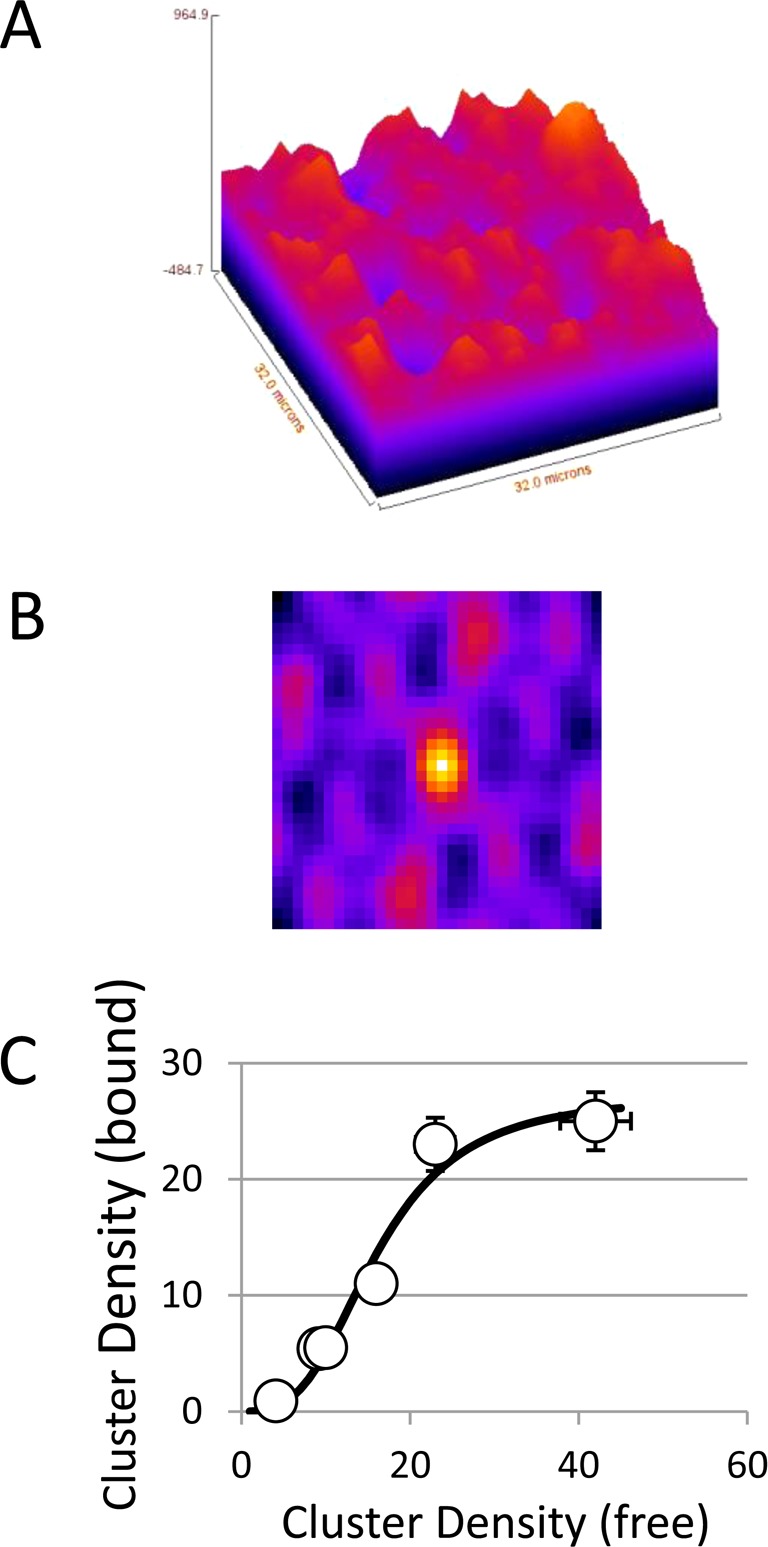
FRET–FLIM–ICS on living BaF/3 cells cotransfected with EGFR–eGFP and Grb2–mRFP. (A) Fluorescence image of EGFR–eGFP/Grb2–mRFP complexes. (B) Spatial autocorrelation image of EGFR–eGFP/Grb2–mRFP complexes. (C) Density of Grb2–mRFP-bound EGFR–EGFP clusters as a function of the density of Grb2–free EGFR–eGFP clusters. The solid line is fit to a Hill function (CDbound = A/(1 + ((Kd/CDfree)(N−1)), with N = 4.1, A = 27, and Kd = 18 clusters).
