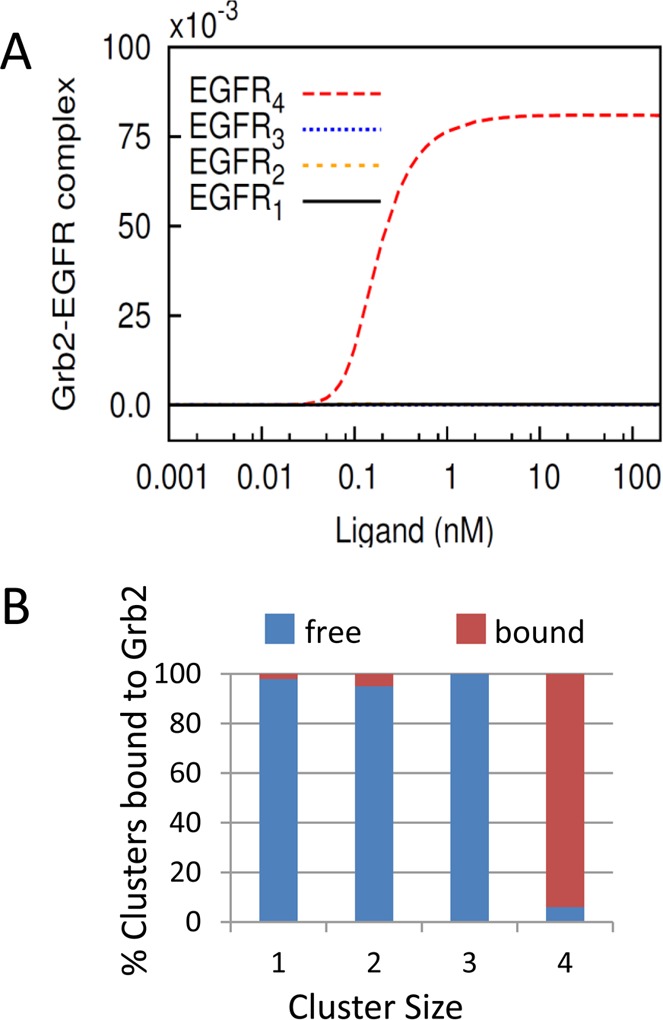
Figure 6.

(A) Plot of simulation results depicting the cluster distribution of Grb2-bound EGFR as a function of EGF concentration. Note that at all concentrations of EGF the EGFR tetramer is the predominant form associated with Grb2. The curves corresponding to dimer and trimer are indistinguishable from monomer because the total number of these oligomeric forms bound to Grb2 is almost negligible. (B) Cluster size distribution of EGFR bound to Grb2 and unbound (free) to Grb2 from simulation with 10 nM EGF.
