
Figure 6.
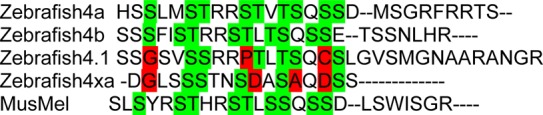
Alignment of zebrafish melanopsins with mouse melanopsin. Alignment of the zebrafish and mouse melanopsin sequences in the identified control region. Shown in green are the phosphorylation sites that are the same as mouse melanopsin, whereas the sites that are divergent from mouse melanopsin are in red.