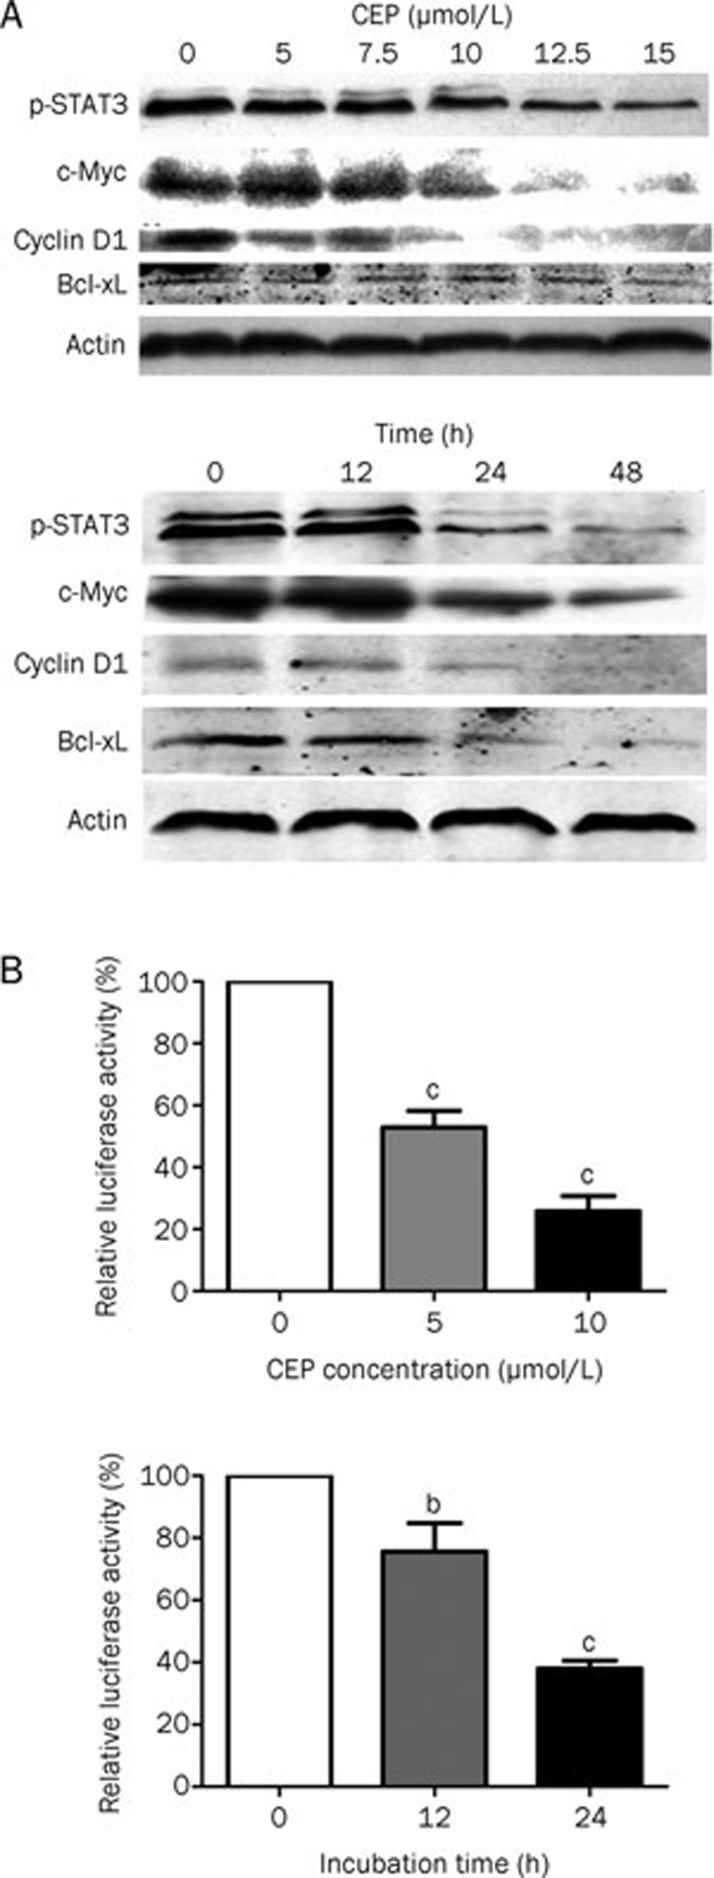
Figure 4.
Inhibition of STAT3 signaling pathway by CEP. (A) Western blotting for p-STAT3, c-Myc, cyclin D1, and Bcl-xL. SaOS2 cells were treated with different concentrations of CEP from 0 to 15 μmol/L for 24 h. For the time course, cells were incubated with CEP (10 μmol/L) for 0, 12, 24, and 48 h. β-actin was used as the internal control. (B) Luciferase assay of APRE plasmids in SaOS2 cells under CEP treatment in different concentrations and at different time points. Cell extracts were prepared and luciferase activities were assayed according to the manufacturer's instruction. Each measured activity of firefly luciferase was normalized by the activity of Renilla luciferase in the same well. The data presents mean relative luciferase activity of three individual experiments (bP<0.05, cP<0.01 vs control).

