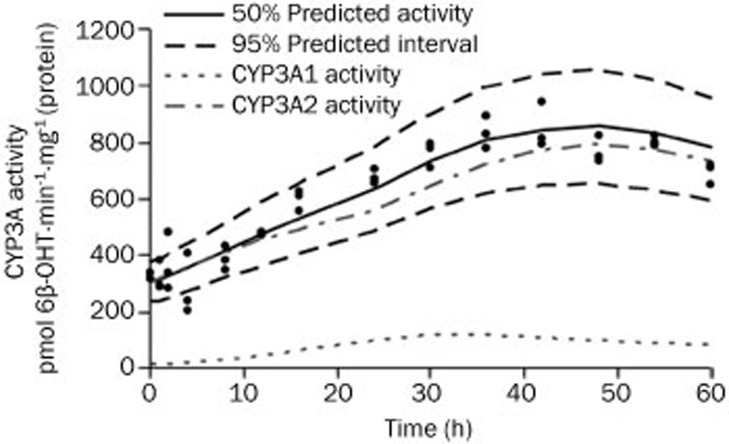
Figure 5.
Time course of CYP3A1/2 enzyme activity after DEX administration. The symbols represents individual data from rats and the solid line represents the model fit lines. The black dashed lines depict 95% prediction interval of the enzyme activity dynamic model. The gray dashed line and the dotted line represent the simulated contributions of CYP3A1 and CYP3A2 to 6β-OHT formation, respectively.

