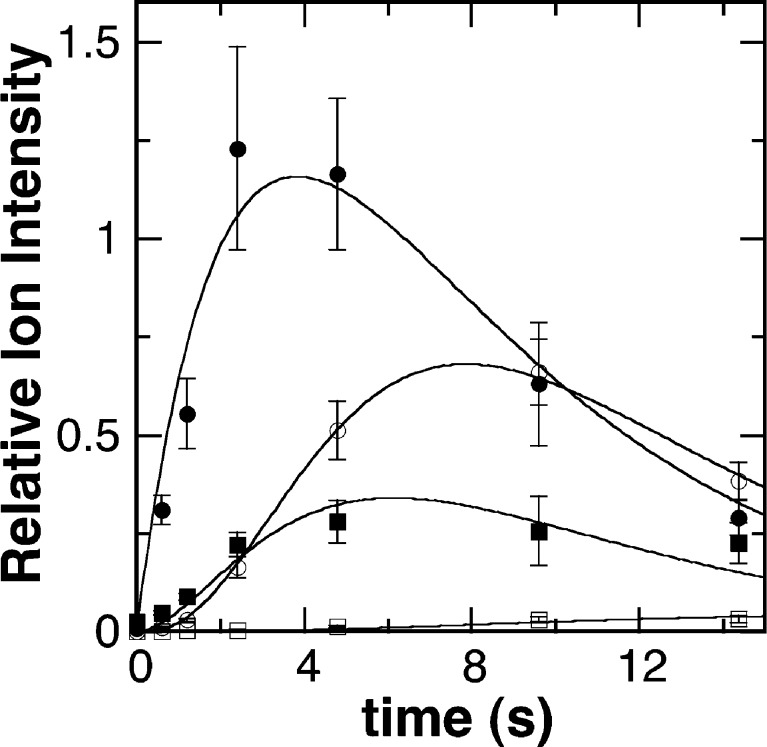
Figure 3.
Time dependence for products of the PAO-catalyzed oxidation of DBDB. The data are reported as the ion intensities for 1 (●), BDB (■), 2 (○), and putrescine (□) relative to that of MPEA. Assay conditions are identical to those described in the legend of Figure 1. The lines are from global fits of the model in Scheme 4 with the values for the rate constants listed in Table 1.

