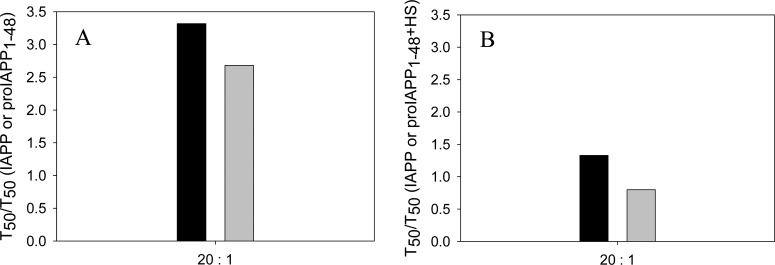
Figure 10.
Bar graph comparing the T50 values for the formation of amyloid by mixtures of IAPP with insulin and mixtures of proIAPP1–48 with insulin in the absence of HFIP. (A) HS is absent in the assay. The data are plotted as T50 normalized by the T50 value of IAPP or proIAPP1–48 in the absence of insulin. (B) HS is present in the assay. The data are plotted as T50 normalized by the T50 value of IAPP or proIAPP1–48 in the presence of HS without insulin. The ratio of IAPP or proIAPP1–48 to insulin was 20:1. Both panels: black bars, mixtures of IAPP and insulin; gray bars, mixtures of proIAPP1–48 and insulin. Values of T50 were derived from the kinetic curves in Figures 6 and 7. The kinetic experiments were conducted in 20 mM Tris-HCl (pH 7.4) without stirring at 25 °C. The IAPP or proIAPP1–48 concentration was 16 μM. The HS concentration was 1.3 μM (when present).

