
Figure 2.
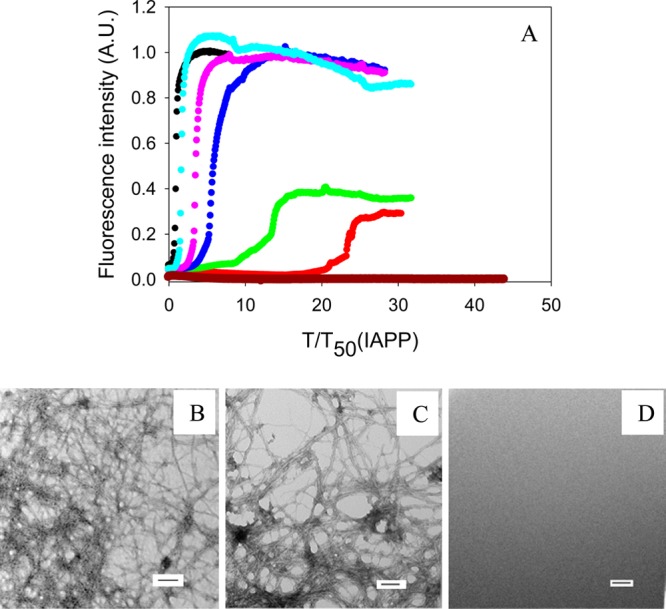
Inhibition of the formation of IAPP amyloid by insulin. (A) The results of thioflavin-T binding assays are displayed. The data are plotted as time normalized by the T50 value of IAPP in the absence of insulin: black, IAPP; red, IAPP and insulin in a 20:1 ratio; green, IAPP and insulin in a 40:1 ratio; blue, IAPP and insulin in a 60:1 ratio; pink, IAPP and insulin in an 80:1 ratio; cyan, IAPP and insulin in a 100:1 ratio; brown, insulin alone at 0.8 μM. (B) TEM image of IAPP. (C) TEM image of a 20:1 mixture of IAPP and insulin. IAPP is in 20-fold excess. (D) TEM image of insulin alone at 0.8 μM. Aliquots were removed at the end of each reaction for TEM analysis. Scale bars represent 100 nm. The kinetic experiments were conducted in 20 mM Tris-HCl (pH 7.4) and 2% (v/v) HFIP without stirring at 25 °C. The IAPP concentration was 16 μM.