
Figure 3.
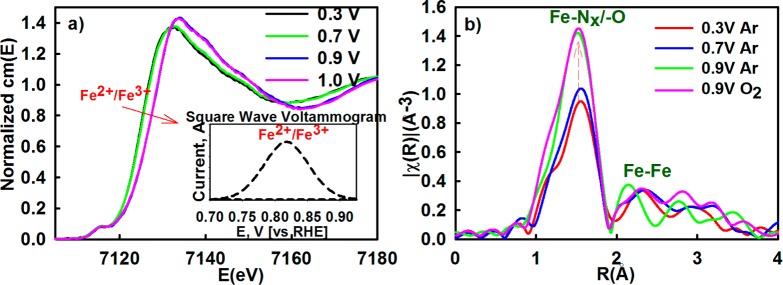
(a) Potential dependent normalized Fe K-edge XANES spectra with corresponding redox peak transition shown in inset as a background-subtracted square wave voltammetry profile collected in oxygen-free 0.1 M HClO4. (b) Fourier Transform of the extended region of the XAS spectra collected in situ at Fe K-edge (7112 eV) of PVAG-Fe catalyst.