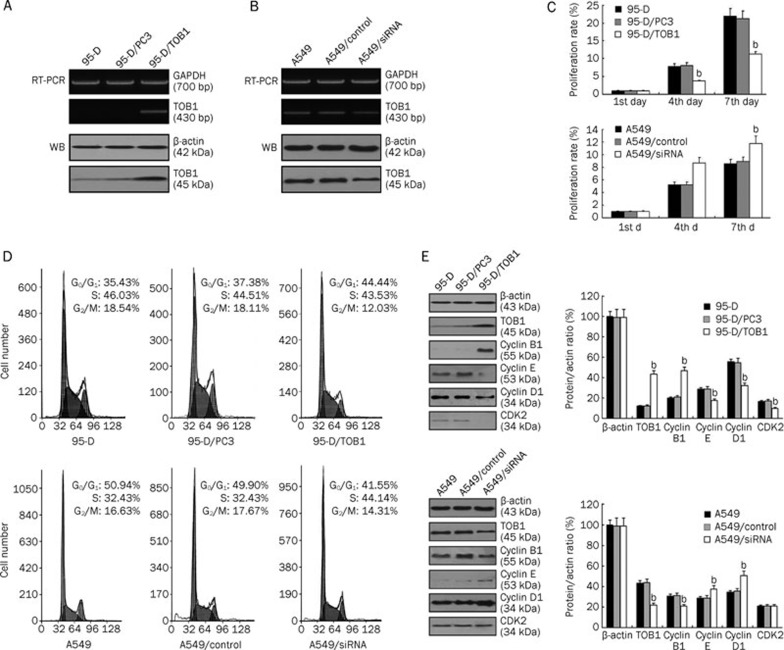
Figure 2.
TOB1 regulates proliferation and modulates cell cycle progression of the non-small cell lung cancer cell lines 95-D and A549. (A) Ectopic TOB1 expression was confirmed via RT-PCR and immunoblotting in a 95-D/TOB1 transfectant and compared with vector-transfected parental cells. GAPDH and β-actin were used as the loading controls. (B) TOB1 expression was significantly reduced (at least 30%) in A549/siRNA-TOB1 cells compared with the parental and control siRNA-transfected A549 cells. TOB1 expression was subjected to RT-PCR and Western blot using specific primer and monoclonal TOB1 antibody. GAPDH gene and β-actin protein expression were utilized as the loading controls. (C) TOB1 overexpression suppresses 95-D cell proliferation in MTT viability assays. In contrast, increased cell growth was observed in the A549/siRNA-TOB1 cells. A total of 4000 cells from each cell line were seeded in a 24-well plate. Cells were counted at d 1, 4, and 7. All samples were prepared in triplicate. The proliferation rate was measured as fold changes in cell growth. (D) TOB1 overexpression induced G1 phase and G2/M phase arrest in the 95-D lung cancer cell line. The decreased TOB1 expression caused a decrease in the G1 population and an increase in the S phase population of A549 cells. Sub-confluent proliferating cells were stained with propidium iodide and subjected to FACS analysis to determine the cell cycle distribution. (E) In the 95-D cells, TOB1 overexpression increased cyclin B1 expression, and negatively regulated the expression of cyclin D1, cyclin E, and CDK2. TOB1-siRNA transfection increased the expression of cyclin D1 and cyclin E, but slightly reduced cyclin B1 expression. The cells were harvested using trypsin and centrifugation. Equal aliquots of the total protein (50 μg) were analyzed by SDS-PAGE and blotted to detect cyclin B1, cyclin D1, and cyclin E protein expression. The protein expression was expressed as fold changes in band density, with β-actin as the loading control. All the experiments were performed independently at least three times. Mean±SD. bP<0.05 vs the control group.

