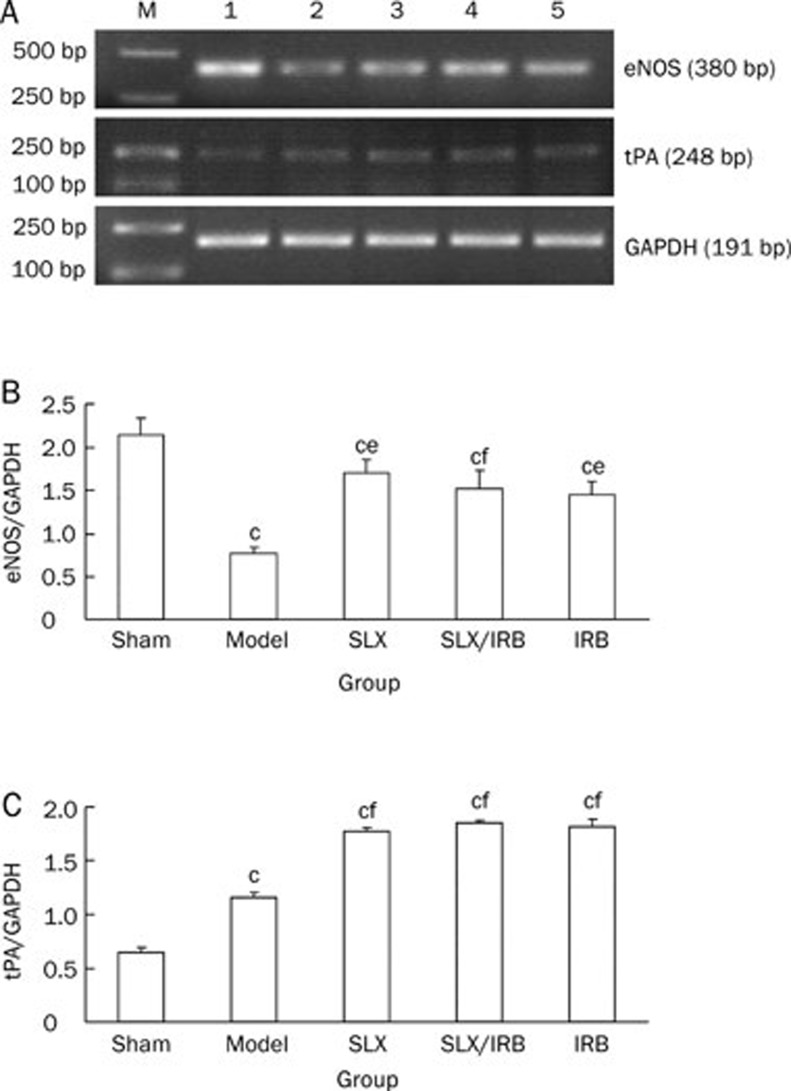
Figure 3.
Semiquantitative analysis of renal mRNA eNOS (A, B) and tPA (A, C) expression after 12 weeks of treatment. bP<0.05, cP<0.01 vs sham group. Mean±SD. Sham: n=12; Model: n=7; SLX: n=10; SLX/IRB: n=11; IRB: n=11. eP<0.05, fP<0.01 vs model control group. M: marker; 1: Sham group; 2: model control group; 3: sulodexide treated group; 4: combined group of sulodexide and irbesartan; 5: irbesartan treated group.

