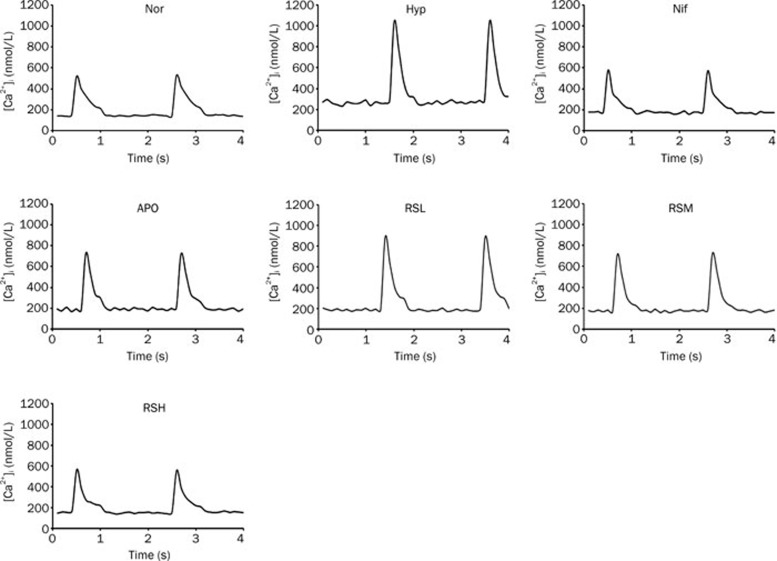
Figure 5.
The curves of [Ca2+]i levels were measured in beating cardiomyocytes isolated from adult rats, which were driven by electric field stimulation in the 7 groups. Normal (Nor), Hypoxia (Hyp, H2O2 10 μmol/L), nifedipine (Nif, 0.1 μmol/L), apocynin (APO, 10 μmol/L), RSL (RS 0.1 μmol/L), RSM (RS 1 μmol/L), RSH (RS 10 μmol/L).

