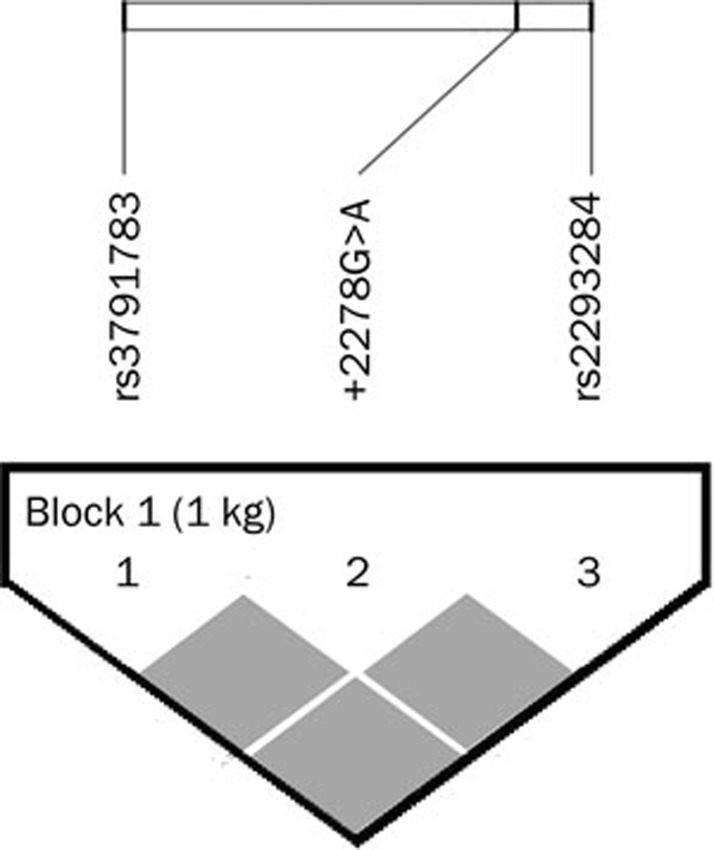
Figure 1.
The linkage disequilibrium (LD) pattern in the Myostatin gene is depicted as an LD matrix. The classic D′ measurement for all pairs of SNP markers was calculated to construct the LD matrix. The D′ value of each panel is substituted with different colors. Squares in red indicate a strong LD.

