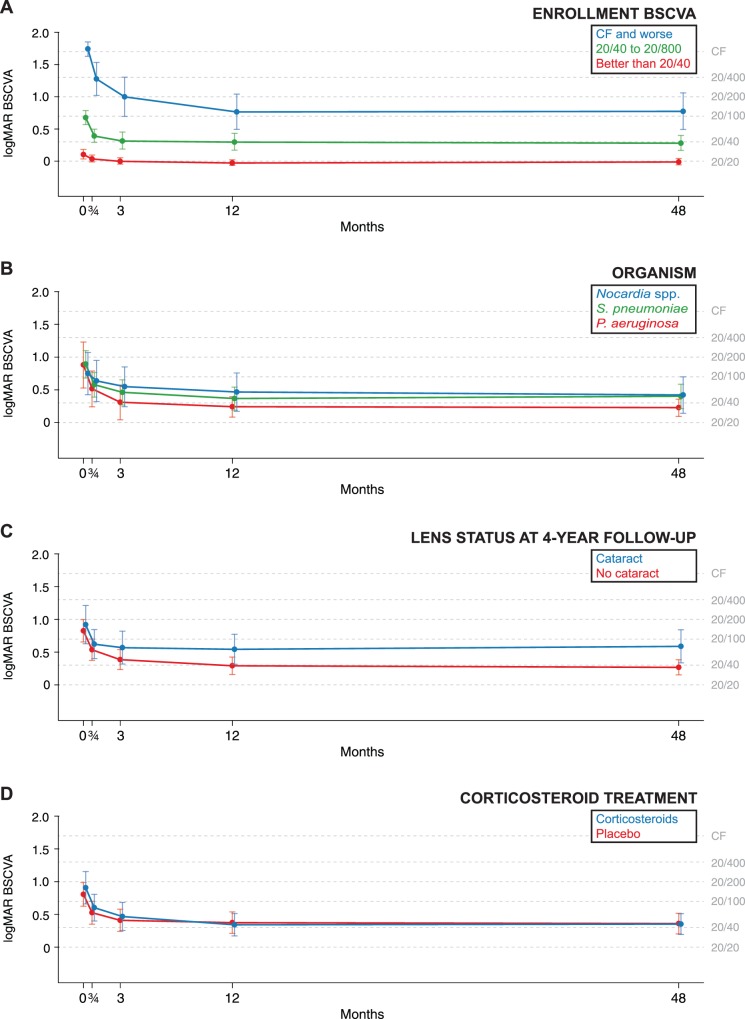
Figure 2.
Subgroup analysis of longitudinal BSCVA in a subset of participants from the SCUT Trial. The predicted means and 95% CIs are shown, stratified by (A) enrollment visual acuity, (B) causative organism, (C) presence of cataract at the 4-year follow-up visit, and (D) treatment allocation in SCUT (steroids versus placebo).

