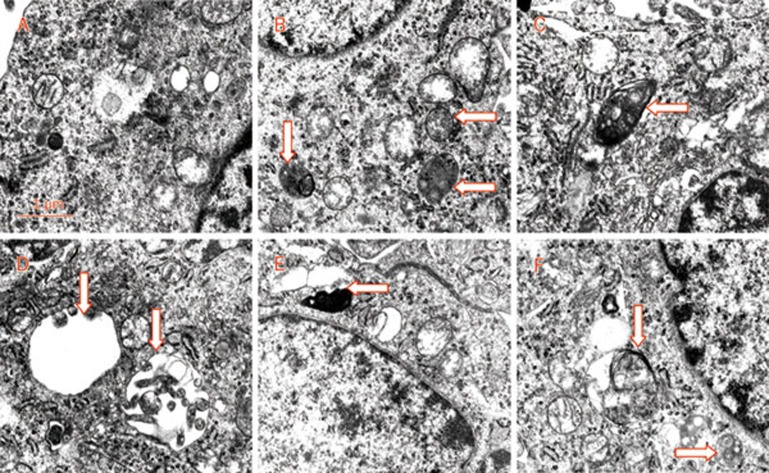
Figure 5.
Representative ultrastructural morphology of autophagy. Normal morphology of cytoplasm, cell organelles in normal control group (A, ×20 000), characteristic ultrastructural morphology of autophagy in OGD/R treated group (B, ×17 000), β-asarone (20, 30, or 45 μg/mL, respectively) group (D, E, F, ×20 000), and nimodipine (10 μmol/L) group (C, ×20 000). Arrows indicate autophagosomes.

