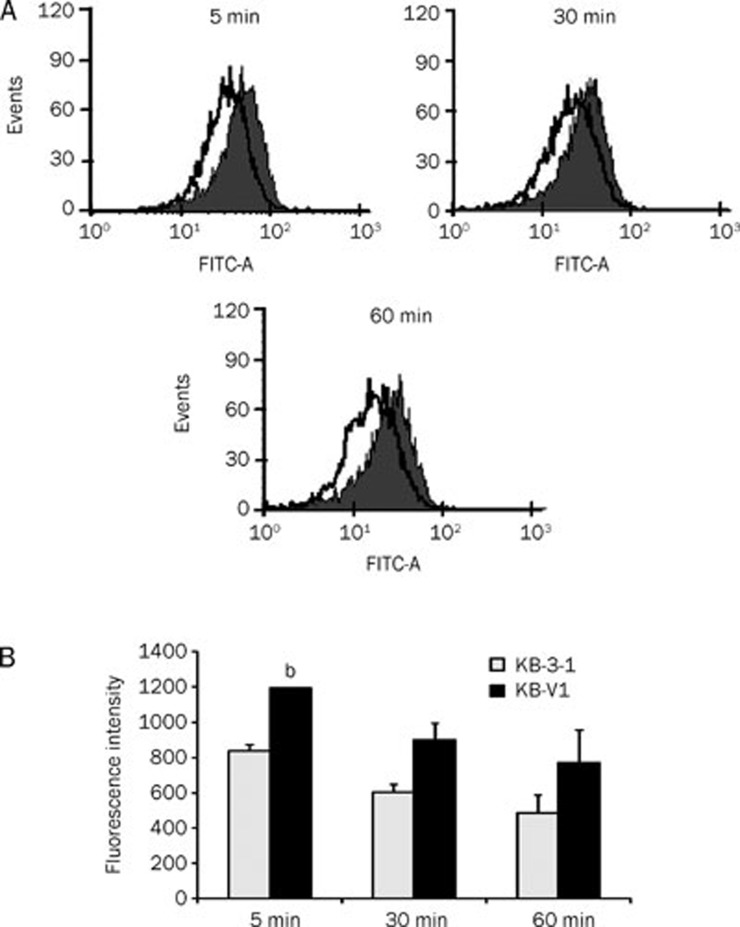
Figure 4.
Specific binding of Cur-NPs-APgp to KB-V1 cells determined by FACS. Gray and blank histograms represent Cur-NPs-APgp targeting to KB-V1 and KB-3-1 cells, respectively (A) and show the fluorescence intensity in bar graph (B). All assays have been demonstrated in duplicate and the mean±standard deviations are shown. bP<0.05 vs KB-3-1 cells.

