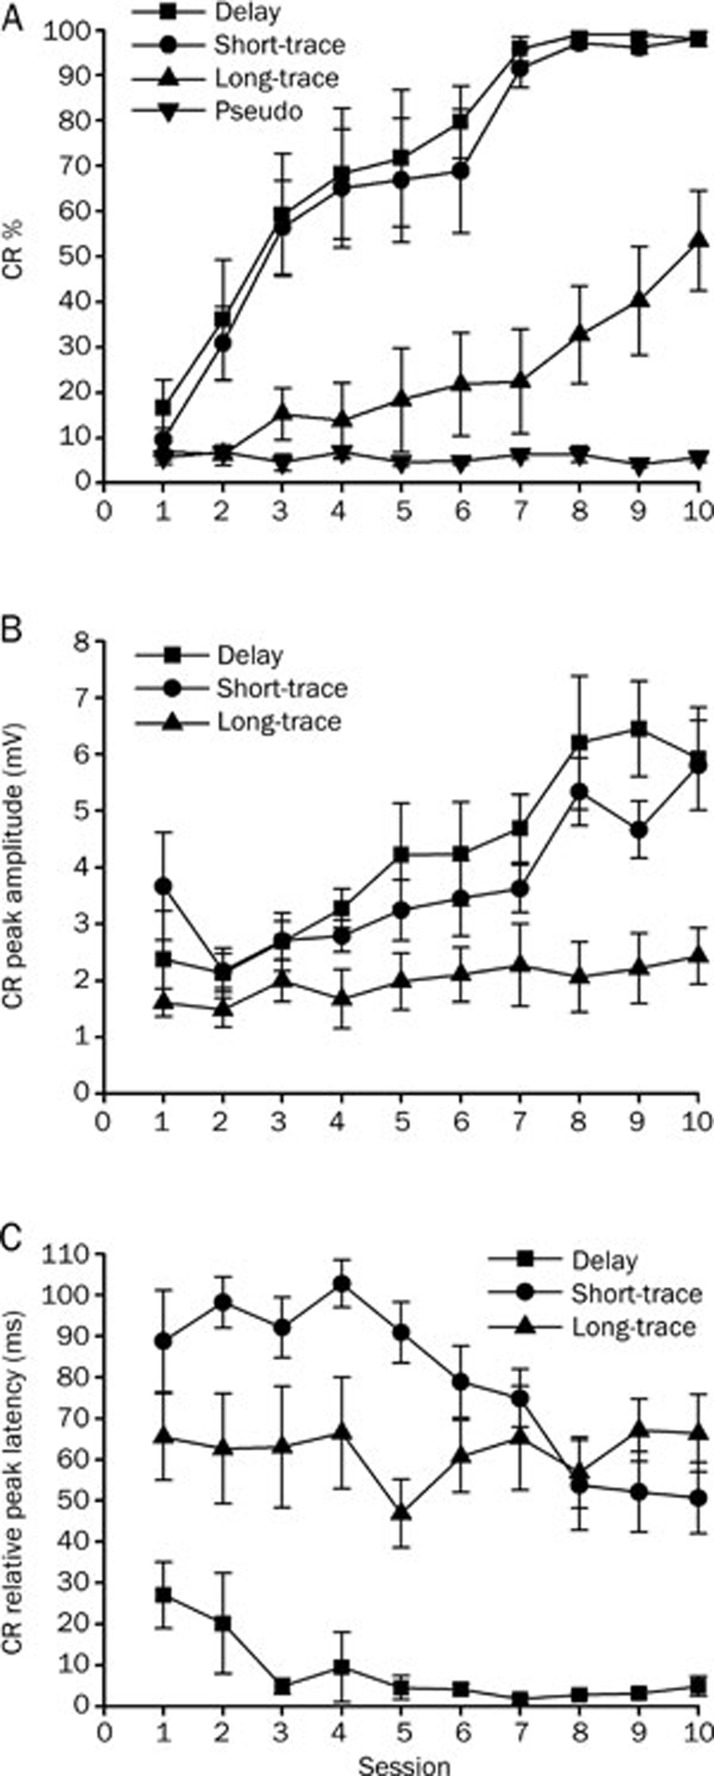
Figure 3.
Acquisition of the eyeblink conditioned responses (CR) for delay (n=8), short-trace (n=9), long-trace (n=8), and pseudo (n=10) conditioned groups given training with a right caudal mPFC conditioned stimulus (CS) across 10 acquisition training sessions. (A) CR percentage, (B) CR peak amplitude, and (C) CR relative peak latency are given as mean±standard error (SEM). Error bars represent the SEM.

