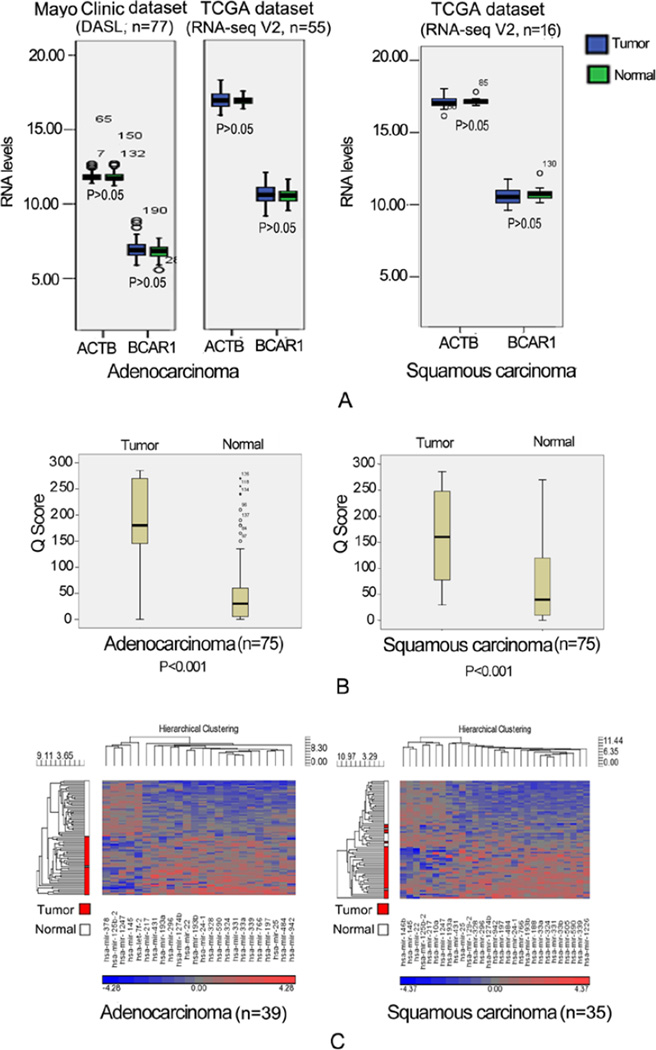
Figure 1. BCAR1-mRNA,-protein and potential miRNA in tumor vs. matched normal tissue.
A: There were no appreciable differences in BCAR1-mRNA expression between tumors and matched normal tissues in either the Mayo Clinic or TCGA dataset; B: IHC stain of BCAR1-protein demonstrated remarkably higher levels of Q scores as compared with matched normal tissues (adenocarcinoma vs. normal tissues: 185±86 vs. 56±72, P<0.001; squamous carcinoma vs. normal tissues: 162±86 vs 75±83, P<0.001); C: The potential BCAR1-miRNAs predicted by tools were significantly different between tumor and normal tissues. 5 in adenocarcinoma and 7 in squamous carcinoma were down-regulated in the tumors.

