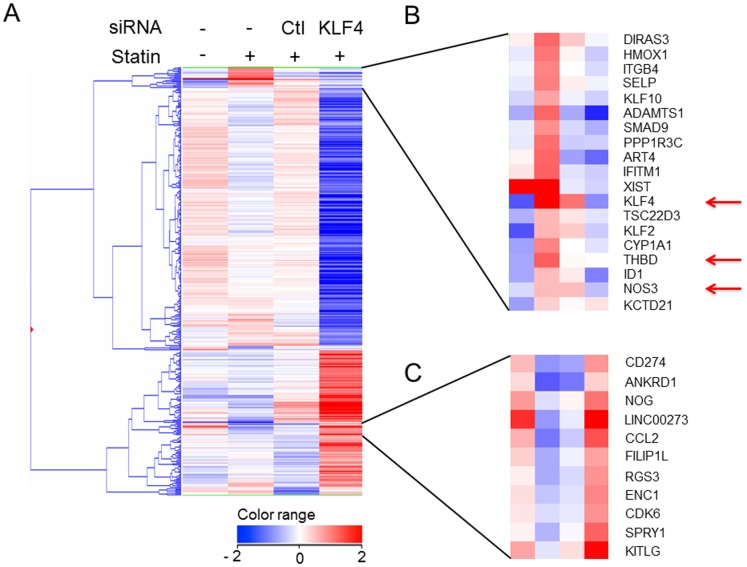
Figure 1. Genes up- or down-regulated by pitavastatin treatment through KLF4 in HUVECs.
Transcriptome data were derived from the average of an array performed 5 times with 1 µM pitavastatin-treated HUVECs and the average of duplicate arrays using HUVECs transfected with KLF4 siRNA or control (Ctl) siRNA, and treated with 1 µM pitavastatin for 4 hours. Fold induction is the representation of a log2 fold change to standardize the induction rate. Whole clustering analysis (A) using 384 selected genes that had significant changes in expression compared to control treatment were selected (See the details in Methods). The cluster shown in (B) contains the genes induced by pitavastatin and suppressed with siKLF4. Note that NOS3 and THBD are included in addition to KLF4. These genes are indicated with red arrows. KLF2 is shown by black arrow. The cluster shown in (C) includes the genes reduced pitavastatin treatment and induced with siKLF4. The sequences of the applied siRNA are shown in Table S2A in File S1.

