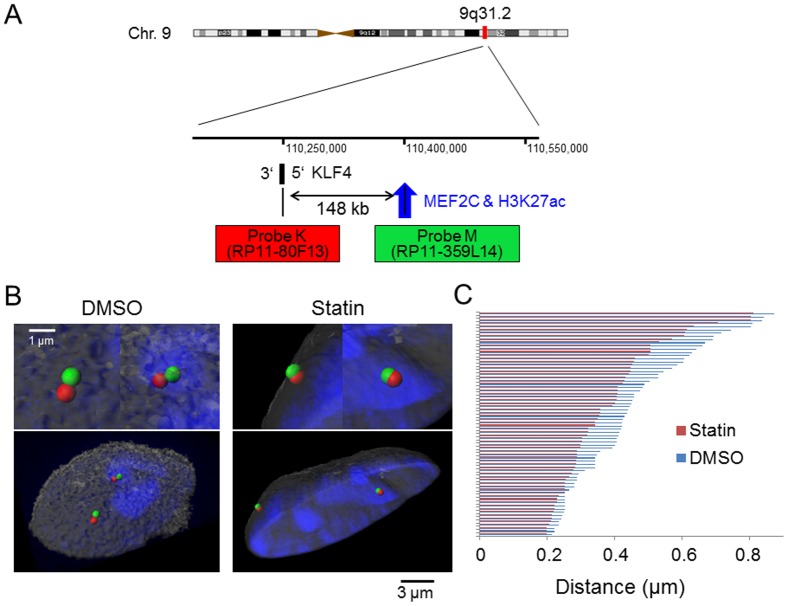
Figure 4. 3D-FISH confirms the proximity of KLF4 and the MEF2C binding region detected by 3C.
HUVECs were incubated with 1 µM pitavastatin for 4 hours. (A) Probe design for the two-color 3D-FISH analysis of the target region on human chromosome 9q31.2. The numbers in the middle indicate the location on chromosome 9 using the hg19 build program. (B) Visualization of two-color 3D-FISH on structurally preserved HUVEC nuclei and an image of the 3D distance. FISH with probes K (red) and M (green) showing the KLF4 gene and MEF2C binding region, respectively. Nuclei were counterstained with TOPRO-3 (blue). 3D reconstruction was carried out on the captured image with Imaris software. The left panel shows the representative image of HUVECs with DMSO and the right panel shows the representative image of HUVECs with statin treatment. Magnified views of each probe sets are shown on top of the whole images. (C) The distance between the KLF4 gene and MEF2C binding region for each condition. The distance was measured using the 3D image processing and analysis software CTMS (Chromosome Territory Measurement Software) (Cybernet Co. Ltd.). 70 chromosomes were analyzed and all of the data are shown in this figure. The average distances between the KLF4 gene and MEF2C binding region are 0.45 µm with DMSO and 0.38 µm with the statin. P<0.05 compared with pitavastatin (−), Wilcoxon rank-sum test.

