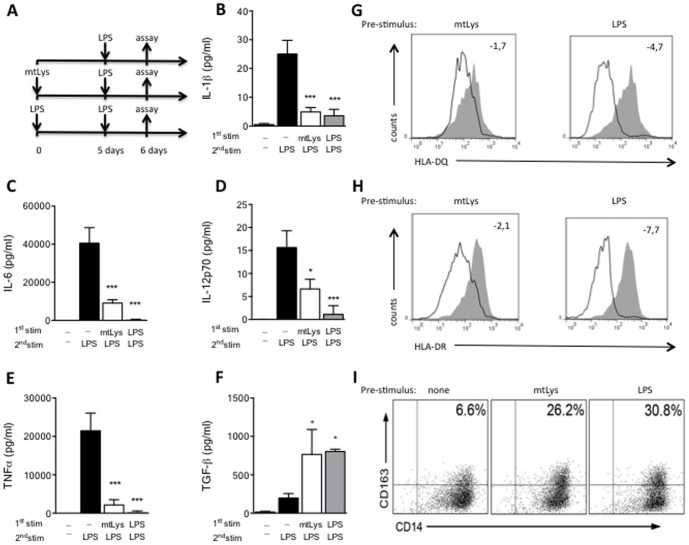
Figure 1. Modulation of human monocytes by exposure to mitochondrial DAMPs.
(A) Workflow diagram: MΦs from HV were pre-exposed to mitochondrial DAMPs (mtLys, 20 µg/ml, white bars), LPS (10 ng/ml, gray bars) or left untreated (black bars) for 5 days, then stimulated for 24 h with LPS, as described in the scheme; B–F: (B) Protein levels of IL1β, (C) IL6, (D) IL12p70, (E) TNFα and (F) TGF-β in culture supernatants (measured by CBA). Data are shown as Mean±SD, n = 3; *p<0.01, ***p<0.001; ns: non-significant vs.corresponding control of untreated 5d +LPS stimulus (ANOVA/Dunn). (G and H): Histogram plots of surface HLA-DQ (up) and HLA-DR (down) expression on CD14+ MΦs evaluated by flow cytometry, after 24 h of LPS challenge in MΦs pre-exposed 5 days to mtLys (left panels) or LPS (right panels), compared to MΦs with no pre-treatment (gray filled, all panels). Mean Fold decrease of MFI compared to corresponding control with no pre-treatment is shown. (I) CD163+CD14+ frequencies in MΦs pre-exposed 5 days to mtLys (central panel), LPS (right panel) or medium (left panel). Representative dot plots of three independently performed experiments are shown. Values in the upper-left quadrants indicate the Mean frequencies of CD163+CD14+ subsets.

