
Figure 4. Modulation of IL10 production after exposure to mitochondrial DAMPs and mitochondrial DNA.
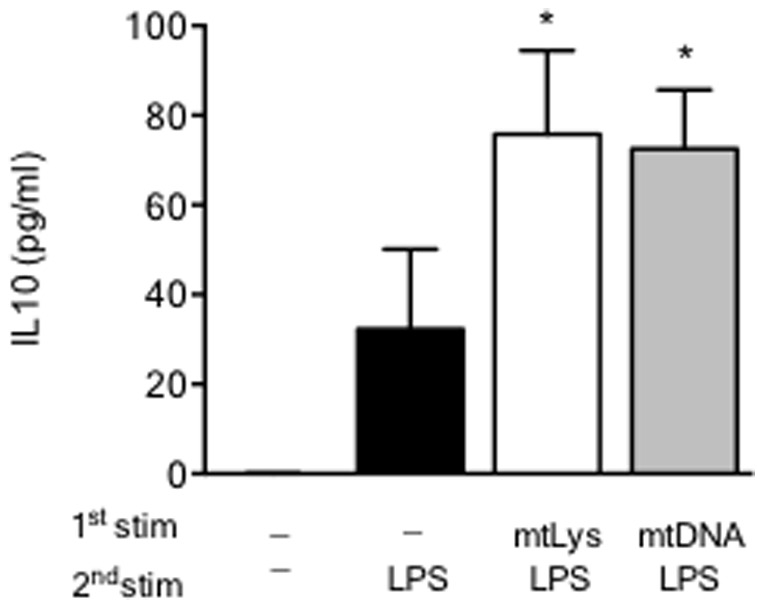
MΦs from HV were pre-exposed to both mitochondrial DAMPs (mtLys, 20 µg/ml, white bars) and mitochondrial DNA isolated from HeLa (mtDNA, 5 µg/ml, white bars) or left untreated (black bars) for 5 days, then stimulated for 24 h with LPS, as described in the scheme of Figure 1 and Figure 3. Protein levels of IL10 in culture supernatants (measured by CBA) is given. Data are shown as Mean±SD, n = 3; *p<0.01 vs. corresponding control of untreated 5d+LPS stimulus (ANOVA/Dunn).