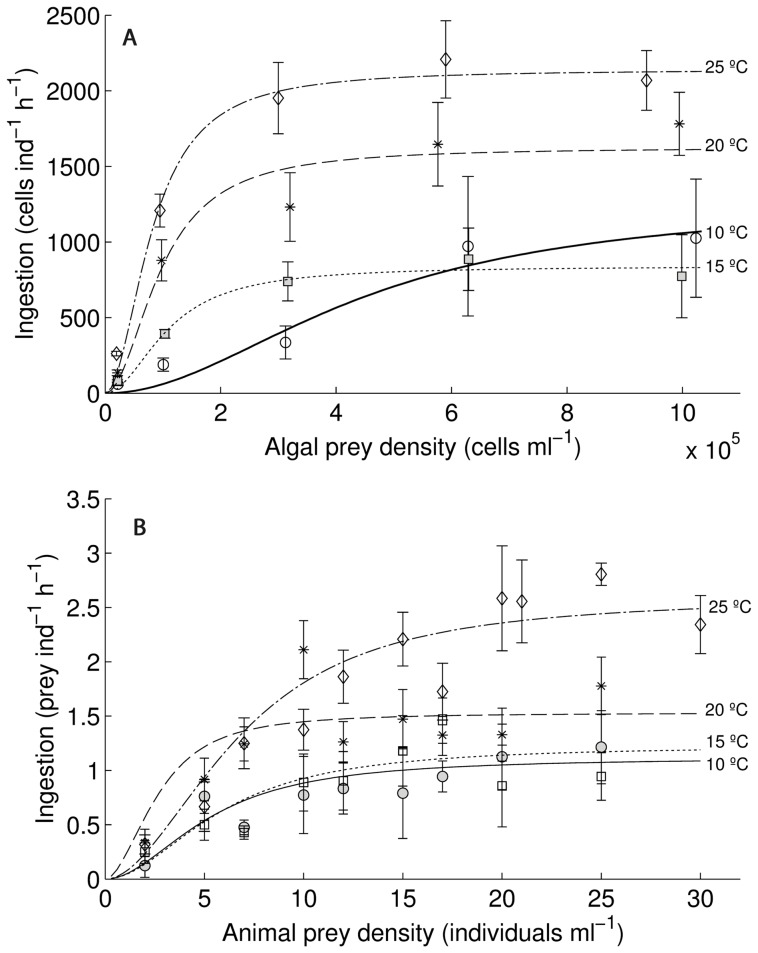
Figure 1. Ingestion, with fits of the integrated Holling type-III functional response to the data for (a) herbivory and (b) carnivory, shown as lines.
Dots and bars represent means and standard errors. Circles and thick continuous line: 10°C; squares and dotted line: 15°C; stars and dashed line: 20°C; Diamonds and dot-dash line: 25°C.

