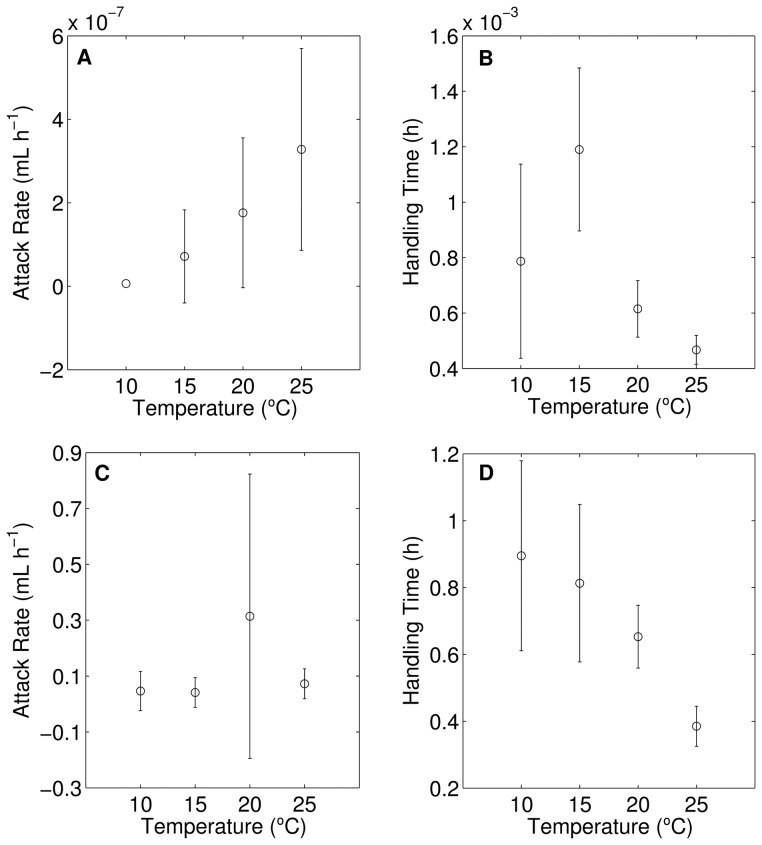
Figure 2. Functional response parameters estimated for the integrated type-III model for herbivore per capita attack rate (a) and handling time (b) and carnivore per capita attack rate (c) and handling time (d) at each temperature (units are given on the ordinates).
Bars represent the upper and lower 95% confidence limits. In the fitting, the handling time at 10°C for the herbivore reached its lower boundary (zero), thus confidence intervals were not estimated (panel a). At 10°C the herbivore's functional response did not reach a plateau, for which reason the estimated handling time at this temperature is less reliable than the others (panel b).

