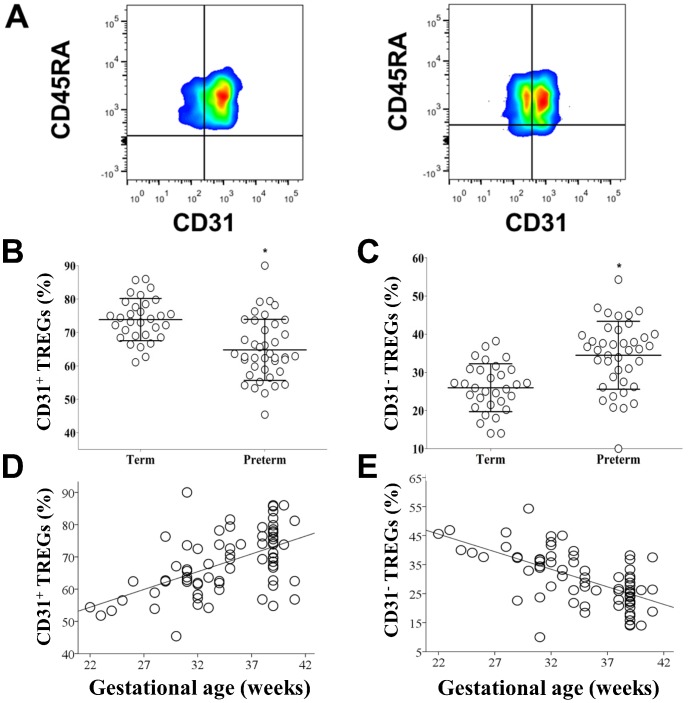
Figure 3. Tregs subpopulations percentages are different between term and preterm infants.
(A) Term CB (first box plot) and preterm CB (second box plot). Tregs were examined for expression of the surface markers CD45RA and CD31. (B) Vertical scatter plot comparing mean percentage of CD3+CD4+CD25+FOXP3+CD45RA+CD31+ in CB of term and preterm infants. Statistical significance was determined by independent sample T-test (*p = 0.0001). (C) Vertical scatter plot comparing median percentage of CD3+CD4+CD25+FOXP3+CD45RA+CD31− in CB of term and preterm infants. Statistical significance was determined by independent sample T-test (*p = 0.0001). (D) Scatter plot graph showing a positive correlation between gestational age (X-axis, in weeks) and CB CD31+ Tregs percentage (Y-axis). Pearson's correlation test used (r = 0.54, p = 0.0001). (E) Scatter plot graph showing a positive correlation between gestational age (X-axis, in weeks) and CB CD31− Treg percentage (Y-axis). Pearson's correlation test used (r = −0.62, p = 0.0001).

