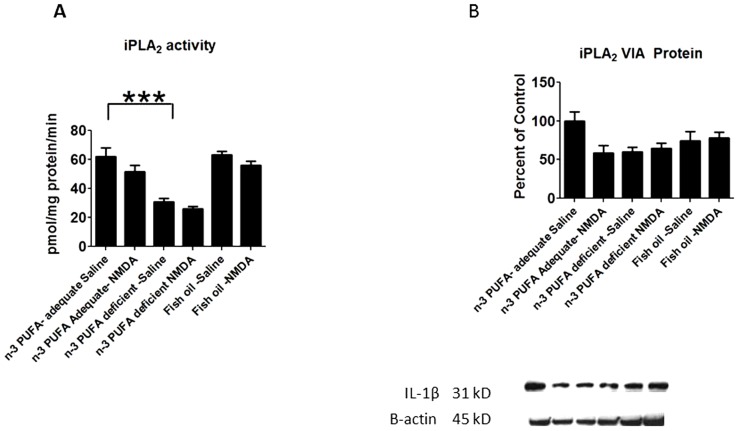
Figure 4. iPLA2 activity and protein expression.
Measured activity of A) iPLA2 enzymes and B) iPLA2 protein levels. Data are expressed as mean ± SEM (n = 6 per group for activity, and 5 per group for protein due to one unquantifiable band per group). Statistical significance is denoted by * p≤0.05, ** p<0.01, *** p<0.001.

