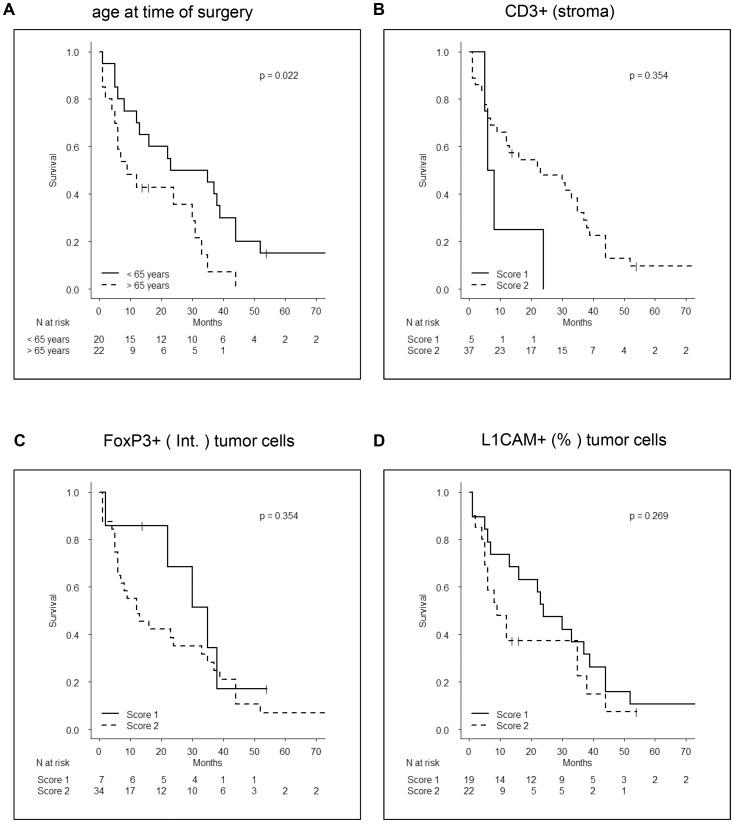
Figure 6. Correlation of stromal and carcinoma-related parameters with patient survival.
Kapplan-Meyer-Curves show the impact of (A) age at time of surgery, (B) CD3+ cells/stroma, (C) FoxP3 expression in tumor cells (intensity) and (D) L1CAM expression in tumor cells (% cells) on survival of patients with T3N1M0 stage. Numbers at risk are depicted below each graph.

