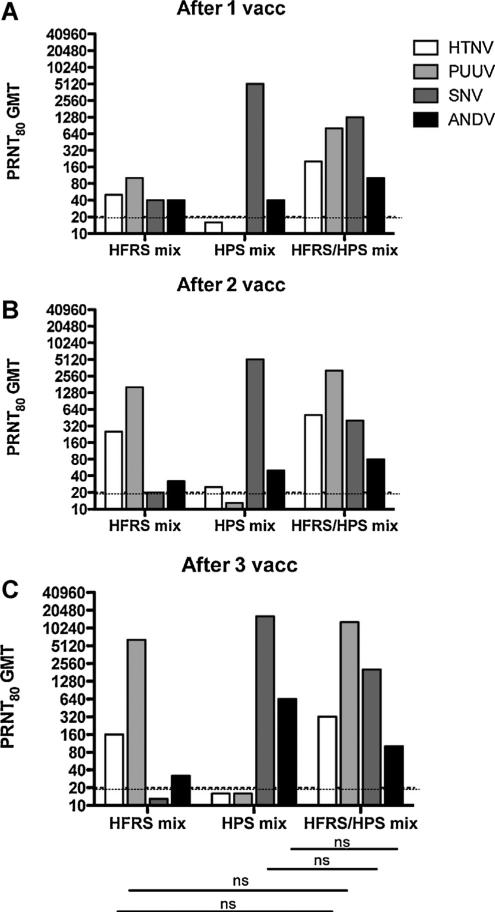
Fig. 3.
PRNT80 GMT against HTNV, PUUV, ANDV, and SNV for each DNA vaccine formulation after 1, 2, or 3 vaccinations. These data are from the same experiment shown in Fig. 2; however, PRNT80 GMT are presented (A) after 1 vaccination, (B)after 2 vaccinations, and (C) after 3 vaccinations. The PRNT limit of detection was a titer of 20 (dashed lines). ns indicates a lack of statistical significance when titers were compared from HFRS or HPS mix to HFRS/HPS mix vaccine. Significance lines pertain to (A), (B), and (C).

