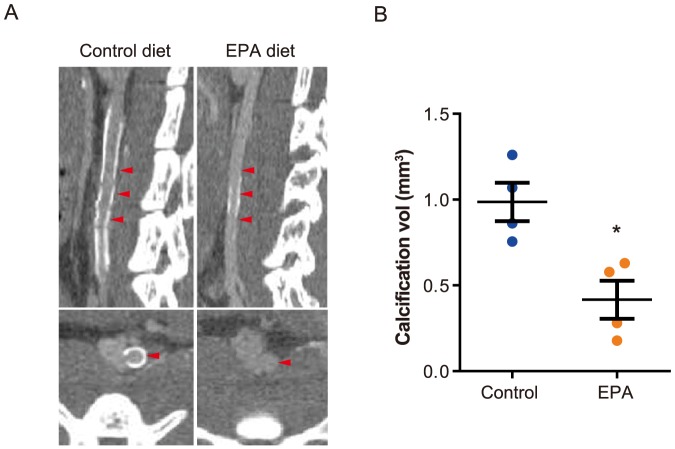
Figure 2. EPA suppressed aortic calcification after AAA-induction.
Aortic calcification was assessed by micro-CT imaging of in situ aortas 6 weeks after perivascular CaCl2 application. Both sagittal and transverse slices (A) show reduced overall calcification in the infra-renal aortas from EPA diet group compared to the control diet group, and this was consistent with the results of quantitative analysis of the total calcification volume in each aorta (B). n = 4 for control diet and EPA diet groups. Red arrowheads indicate the posterior wall of the infra-renal aorta. Representative images of two independent experiments are shown in A. *P<0.05 compared to control diet group.

