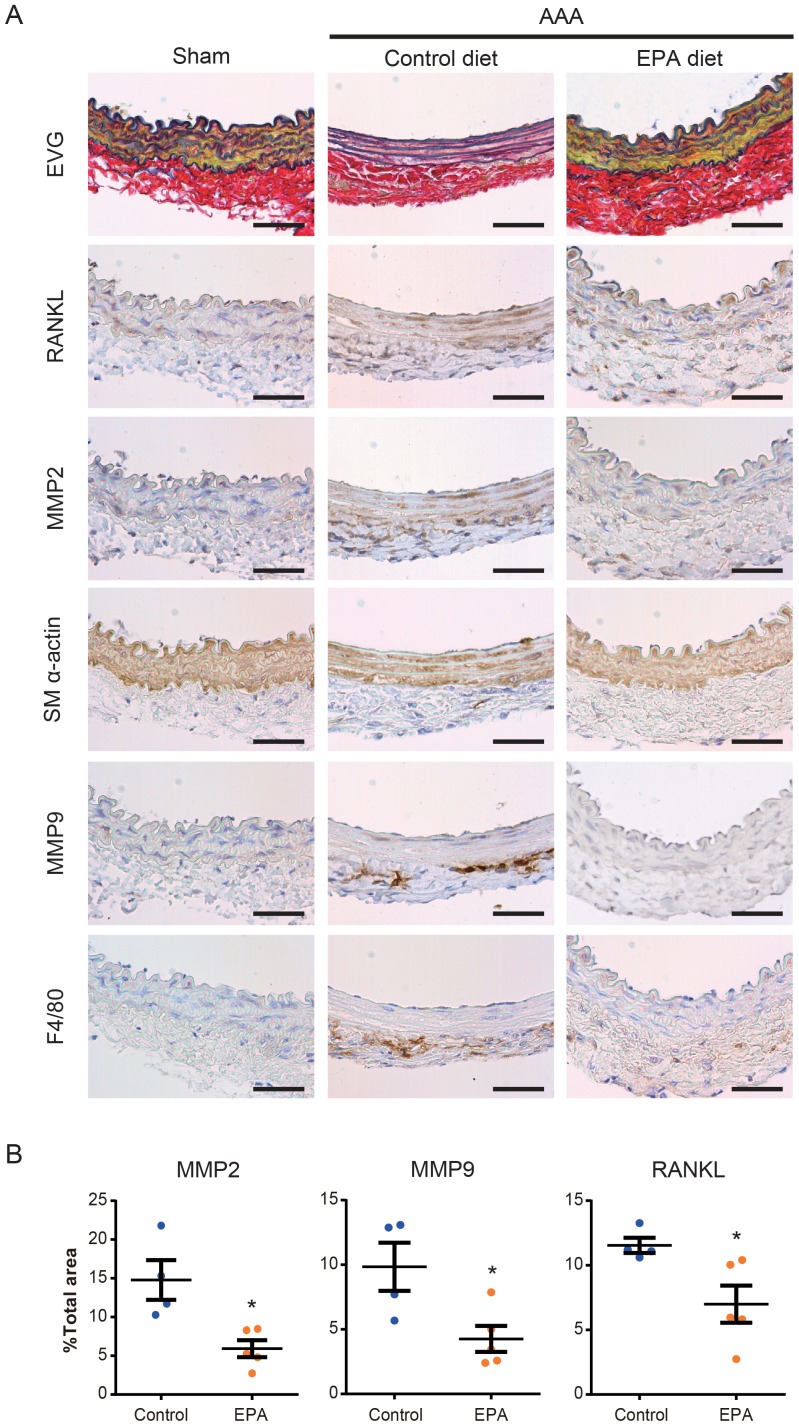
Figure 4. MMP2, MMP9, and RANKL expression in AAAs.
A. Immunohistochemical staining for indicated proteins of serial sections of aortas one week after CaCl2 treatment. Elastic van Gieson staining is also shown. SM α-actin and F4/80 were stained to locate SMCs and macrophages, respectively. Shown are representative images of 4 or more samples in each group. Scale bars, 50 µm. B. Relative positive staining area of MMP2, MMP9, and RANKL in sections from control diet and EPA diet groups. n = 4–5. *P<0.05.

