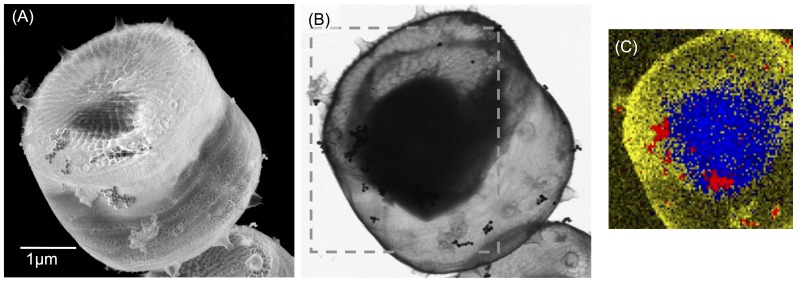
Figure 2. Scanning electron microscope images of a diatom exposed to AgNPs using the signal from the surface (A) and in transmission (B).
(C) shows the EDX map of carbon (blue), silicon (yellow) and silver (red) of the area indicated by the dashed squares in (B) assigned to the organic part, the exoskeleton and AgNPs respectively (scale bar common to the pictures (A) and (B)).

