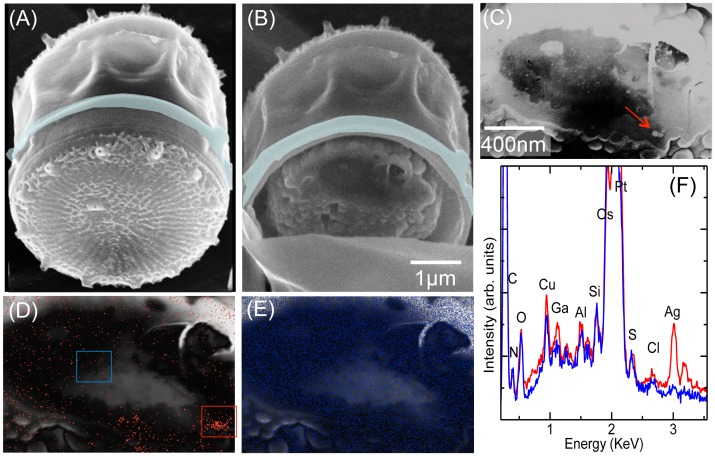
Figure 4. Sequence of the cut and detection of Ag content in the section from the same cell shown in Figure 3 .
(A), the cell after the deposition of the Pt protective layer. (B), the cell after the cut; (C) an enlargement of the section of the cell with an enhanced contrast. (D) and (E), the Ag and Os EDX maps respectively over the Secondary Electron signal collected by the EDX detector. (F) EDX spectra from the background (blue) and the bright spots (red) corresponding to the blue and red square area shown in the panel (D). The bright spots are also marked by the red arrow in panel (C).

