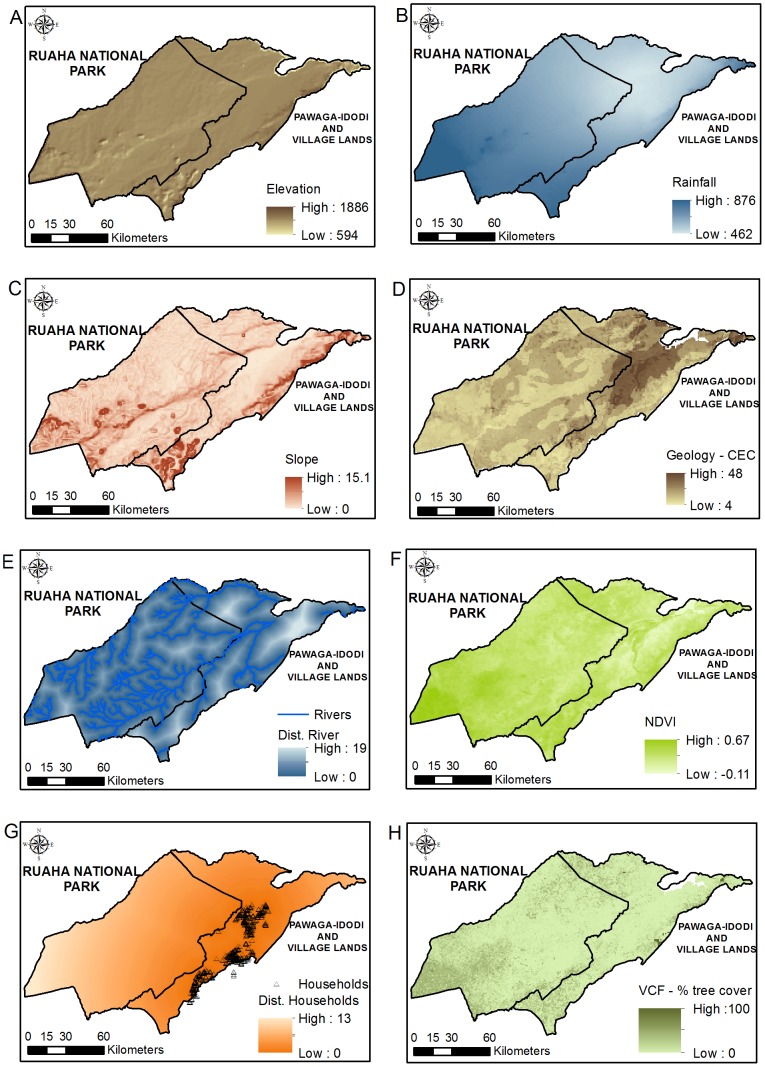
Figure 2. Representation of variables used for predicting the distribution of large carnivores in the Ruaha landscape.
Representation of raster files used for the predictive modelling of the distribution of lions, leopards and spotted hyaenas in the Ruaha landscape. A. Elevation (m), B. Rainfall (mm), C. Slope (degrees), D. Geology – cation exchange capacity, E. Distance to rivers (km), F. NDVI, G. Distance to households (km) and H. VCF (% tree cover).

